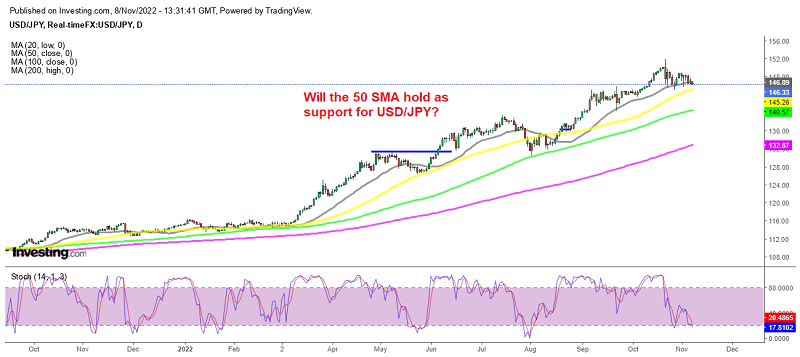
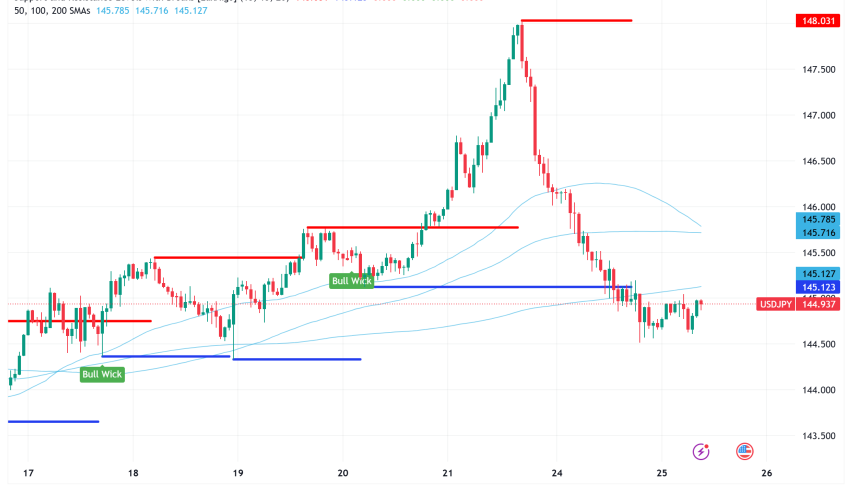
Opening A Buy USD/JPY Signal, With the Daily Chart Oversold
USD/JPY has retreated in the last several days but we decided to open a buy signal since the main trend is still bullish and the FED is hiki

USD/JPY has been on a bullish trend, which has slowed recently as the BOJ has intervened, bu as long as the policy divergence between the Fed and the BOJ continues to play out, it is tough to argue for a change in momentum in USD/JPY in the bigger picture. The recent intervention play from Japan officials just above 150.00 is also a factor that has helped to stifle bulls temporarily but price remains elevated above 145.00 – which is arguably a resting point for buyers.
USD/JPY Vs US Treasury Yields Chart

The above chart says it all. The pair has traded lockstep with the bond market this year as soaring Treasury yields on the back of a more hawkish Fed has underpinned price action. The recent retreat in bond yields has also helped but with inflation data coming up this Thursday, a hotter-than-expected reading could reignite the flames once again.
For now, price action is very much caught in between 145 and 150 as the bond rout stalls and as intervention play presents itself. However, if the selling in bonds starts to pick up again, there is still only one direction that USD/JPY will be headed towards, no matter if Japan wants to try and counteract that.
If there is to be a turning point, perhaps the inflation data later this week could provide a catalyst. If the numbers are soft, that might be reason enough for a correction back towards the 100-day moving average (red line) and 140.00 next.
Household Spending in Japan
- Household spending MoM +1.8% vs 1.7% expected
- Prior household spending was -1.7%
- Household spending YoY +2.3%
- Check out our free forex signals
- Follow the top economic events on FX Leaders economic calendar
- Trade better, discover more Forex Trading Strategies
- Open a FREE Trading Account


