Bitcoin Steady Above $16,850 – Quick Technical Outlook
Bitcoin's price began a downward retreat from the $17,500 barrier level. BTC is trading above the $16,800 support level and may begin a new
Bitcoin’s price began a downward retreat from the $17,500 barrier level. BTC is trading above the $16,800 support level and may begin a new upward trend. Bitcoin’s price attempted to rise above the $17,500 resistance level once more. However, BTC has yet to break through the $17,400 barrier. Before the negative reversal, a high was formed near $17,440.
A move underneath the $17,200 support zone and the 100 hourly simple moving average occurred. On the other hand, the bulls were active above the $16,800 support zone. The BITCOIN price has produced a low near $16,888 and is now consolidating losses.
Above $17,000, there was a slight increase. Bitcoin is trading close to $17,000 and the 100 hourly simple moving average. Furthermore, there was a breakout just above the 23.6% Fib retracement line of the latest slide from the swing high of $17,440 to the low of $16,888.
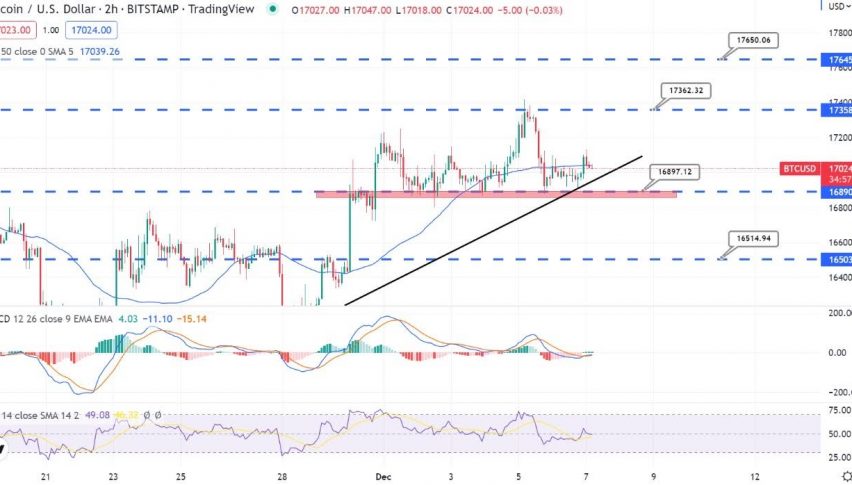
Bitcoin (BTC/USD) Technical Outlook
On the hourly chart of the BTC/USD pair, there was also a break over a significant contracting triangle with resistance near $17,000. On the upside, an immediate resistance level is near $17,170. It is close to the 50% Fib retracement level of the latest collapse from the swing high of $17,440 to the low of $16,888.
The first big obstacle is near $17,200, at which point the price may begin another steady rise. The price might move toward the $17,450 resistance in the scenario above.
The next big barrier is near $17,500, above which the price will rise in the near term toward the $18,000 zone. If Bitcoin fails to break over the $17,170 barrier level, there could be further negatives. On the downside, there is immediate support near $16,880.
The next big support level is at $16,800. A breach below the $16,800 support level could signal a slide toward $16,500. Any further losses could potentially test the critical $16,000 support zone in the near term.
- Check out our free forex signals
- Follow the top economic events on FX Leaders economic calendar
- Trade better, discover more Forex Trading Strategies
- Open a FREE Trading Account