Forex Signals Brief for March 8: USD Resumes Uptrend As Central Banks Resume Hawkish Rhetoric


Yesterday’s Market Wrap
Risk sentiment improved toward the end of last year, as central banks were starting to soften the hawkish rhetoric, on a slower global economy and cooling inflation. As a result, risk assets turned bullish while the USD retreated after being bullish for a year. With the start of this year though, the US economy in particular has been showing signs of improvement, while inflation is not slowing down as much, particularly core CPI (consumer price index).
As a result, the FED and other central banks have been increasing the hawkish tone and yesterday Jerome Powell gave the market a nod that the FED will continue with rate hikes, toward 5.75%, which turned the sentiment negative and sent the USD surging higher. Risk assets such as stock markets tumbled lower, helped by hawkish comments from other central bankers as well. The SNB chairman Jordan said that they cannot rule out that the SNB will have to tighten monetary policy again.
Today’s Market Expectations
Earlier this morning we had the German industrial production and retail sales reports which showed a return to growth in February after a decline in January. The Eurozone Q2 GDP is expected to be revised lower to 0.0% in a while, from 0.1% previously. Later in the US session, we have the ADP non-farm employment change, followed by JOLTS job openings and the second day of Powell’s testimony. But the highlight of the day will be the Bank of Canada meeting, although they are expected to pause rate hikes now and keep them at 4.50%.
Forex Signals Update
Yesterday we continued with the positive performance as the USD resumed the uptrend from February, while risk assets showed weakness and were retreating lower. We opened six trading signals in total, with five of them hitting the take profit targets.
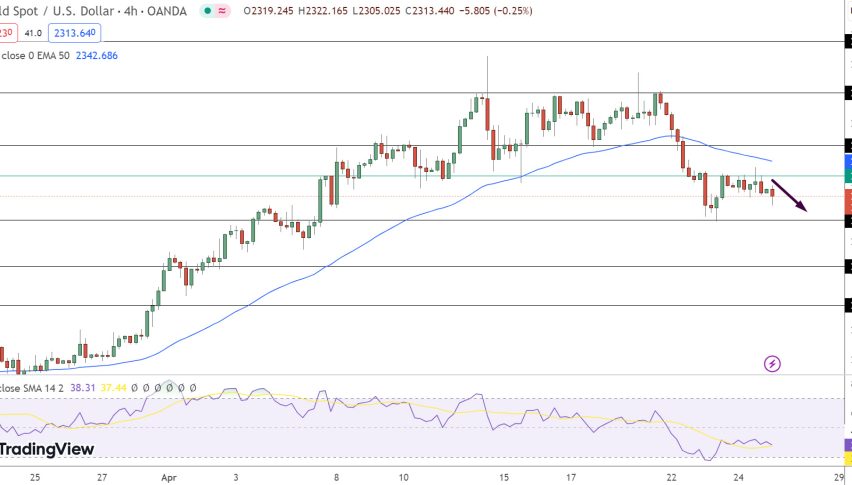
The 20 SMA Rejecting [[Gold]

XAU/USD – Daily chart
EUR/USD Heading Toward 1.05
On the daily chart, we see that moving averages have been doing a great job acting as support during a bullish period and as resistance during bearish periods for EUR/USD. This pair has been bullish since October and the 20 SMA (gray) was doing a great job as support, indicating that the bullish pressure was strong. But, it was broken as USD buyers returned and now the price is facing this moving average and the 50 SMA (yellow) after yesterday’s retrace higher. This was the end of the retrace and yesterday we saw a 1450 pip decline.

EUR/USD – Daily chart
Cryptocurrency Update
In the last two months, we have seen some decent bullish price action in the crypto market, pushing BTC above $25,000, which was a good sign that the crypto winter might be over. Although, last week we saw a retreat in cryptocurrencies but in the last few days the price action has died out and digital coins have been trading in a very tight range.
BITCOIN Resumes Decline As Risk Sentiment Deteriorates
Bitcoin has been retreating in the last two weeks, after being bullish since early January. The price slipped lower after buyers failed to hold gains above $25,000, but it was consolidating around $23,000 for several days. Yesterday though, the retreat resumed after Powell’s comments, which hurt risk sentiment.

BTC/USD – 240 minute chart
ETHEREUM Heading for $1,500
Ethereum pushed above moving averages in January which soon turned into support, especially the 200 SMA (purple). But, buyers are having difficulties at the resistance zone below $1,800 and last week sellers pushed the price below the 50 daily SMA. So, let’s see if the 200 SMA will hold again now.