Gold XAU Looking to Break the 100 Daily SMA As Sellers Return
Gold tried to turn bullish this week, but the bounce failed and XAU closed the week near the lows, which points further down
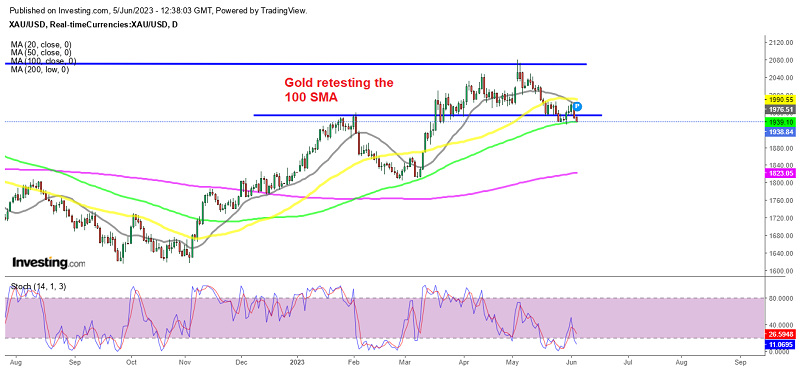
Gold has been experiencing a downward trend for approximately one month, failing to surpass its record high of $2,075 early in May. Despite this consistent decline, the 100-period Simple Moving Average (SMA) represented by the green line, has acted as a support indicator, preventing further downward movement.
On Thursday, Gold experienced a 1% gain after bouncing off this moving average, reaching a peak not seen in over a week. This increase was attributed to the decline in the value of the USD, following the weaker economic data in the United States. There is an expectation now that the Federal Reserve will refrain from raising interest rates during this month’s policy meeting.
Recent inflation indicators released last week indicated a significant slowdown. As a result, the likelihood of the Fed keeping rates unchanged next month has risen to approximately 70%, a substantial increase from the earlier probability of 30%. This shift in expectations was influenced by comments from Fed officials, including the vice chair-designate, suggesting that a rate hike may be skipped in June.
The decline in the US dollar contributed to the increase in Gold prices, making the precious metal more affordable for holders of other currencies. XAU/USD rebounded off the 100 SMA (green) and tested the 50 SMA (yellow) towards the end of the previous week. However, on Friday, we witnessed a bearish reversal in Gold as buyers of the USD returned to the market. As a result, the price is now heading toward the 100 SMA once again, leading us to maintain a bearish outlook on Gold.
Gold Weekly Chart – The 20 SMA Holding As Support 

The bounce off the 50 SMA last week failed
The weekly chart though is still painting an unclear picture for Gold. The 20 SM (gray) held as support for Gold, but the bounce failed and the price returned near the lows at the end of the week. Stochastic is still pointing down though which shows that there is still room to fall further, so we might see a breakout of the 20 SMA.
Gold Live Chart
- Check out our free forex signals
- Follow the top economic events on FX Leaders economic calendar
- Trade better, discover more Forex Trading Strategies
- Open a FREE Trading Account
- Read our latest reviews on: Avatrade, Exness, HFM and XM
Related Articles


Sidebar rates
Related Posts
