GBP/USD Steady Near 1.2500; Market Dynamics and Predictions
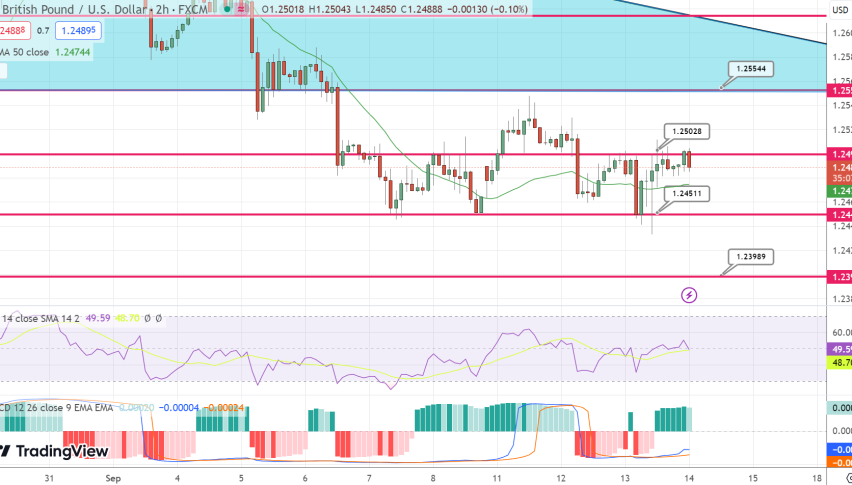
On Wednesday, the GBP/USD experienced a moderate increase, settling at 1.2485.

On Wednesday, the GBP/USD experienced a moderate increase, settling at 1.2485. Despite an early push by bearish traders dragging the pair down to 1.2433 — proximate to the 200-day Simple Moving Average — bullish forces swiftly counteracted the decline.
Reflecting on the pronounced downturn from the previous week, wherein the pair plummeted almost 1%, it appears that the bearish momentum is waning. The daily chart illustrates this with the Relative Strength Index (RSI) firmly established in the negative zone beneath its median. Moreover, its steady trajectory, coupled with the Moving Average Convergence Divergence (MACD) emitting red indicators, suggests a restrained bearish environment. Unless there’s a resurgence in bearish momentum, it’s probable that the GBP/USD will hover around the 1.2430 mark in the upcoming sessions, offsetting recent downturns. Nevertheless, traders should closely monitor the 20-day SMA, as its trajectory indicates a potential bearish intersection with the 200-day SMA, potentially catalyzing renewed bearish momentum.
 In terms of pivotal points, should the bullish traders not sustain the 200-day SMA, support levels may be established at 1.2400, 1.2370, and 1.2350. Conversely, bullish targets stand at 1.2500, 1.2540-50, with the 20-day SMA pegged at 1.2600.
- Check out our free forex signals
- Follow the top economic events on FX Leaders economic calendar
- Trade better, discover more Forex Trading Strategies
- Open a FREE Trading Account


