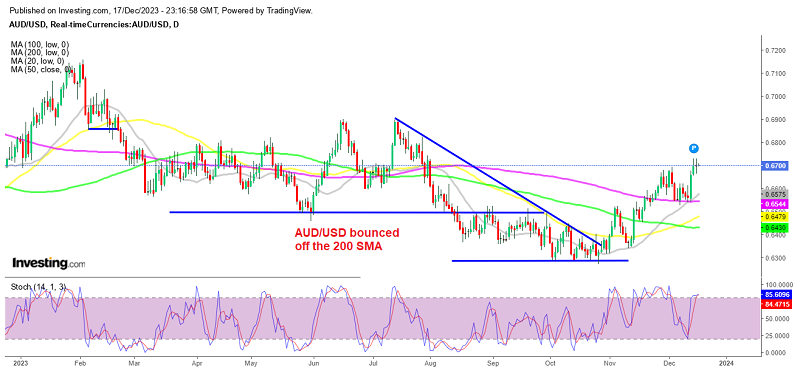
AUD/USD Heading for 0.68 after Bouncing off the 200 Daily SMA
AUD/USD has been positive since early October, with the upside regaining momentum by the middle of last week, owing primarily to dovish stat

AUD/USD has been positive since early October, with the upside regaining momentum by the middle of last week, owing primarily to dovish statements made by the FED, which is not expected to raise rates again as inflation in the USD continues to decline. Instead, Powell mentioned rate cuts on Wednesday, confirming the market’s fears that the FED would start lowering interest rates starting from Q1 of last week.AUD/USD has been positive since early October, with the upside regaining momentum by the middle of last week, owing primarily to dovish statements made by the FED, which is not expected to raise rates again as inflation in the USD continues to decline. Instead, Powell mentioned rate cuts on Wednesday, confirming the market’s fears that the FED would start lowering interest rates starting from Q1 of last week.
AUD/USD Daily Chart – The 200 SMA Held As Support
The RBA held its meeting two weeks ago and stated that, while inflation in Australia has peaked, it remains excessive and is proving to be more persistent than forecasted a few months ago. Although the central bank maintained the usual data-dependent rhetoric. However, the CPI inflation report that followed was pretty soft, which showed that inflation is heading toward the target, and with the fall in Oil prices the decline will accelerate.
Besides that, the latest labor market report for November exceeded expectations, but the unemployment rate rose more than predicted. Also, the recent Australian PMIs for both Manufacturing and Services showed that these sectors dropped further into recession. The markets now anticipate that the RBA will begin reducing rates in Q4 2024.
Another bullish factor for this pair has been the recent improvement in the Chinese economy, which is not going too smooth, but the situation is getting better after the intervention by officials, following the scare in summer. So, AUD/USD has maintained a steady bullish tone, with better-than-expected China retail sales and industrial production figures released last week, adding to the bullish near-term view formed by the Fed’s dovish statement.
AUD/USD recently broke above the 200 SMA (purple) on the daily chart, which then turned into support and we saw a bounce off this moving average following the surprise dovish FOMC meeting. This has opened the way for a rally toward the 0.68 resistance level, where we can expect sellers to enter with a defined risk above the level, aiming for a drop back into the 0.65 support.
AUD/USD Live Chart
- Check out our free forex signals
- Follow the top economic events on FX Leaders economic calendar
- Trade better, discover more Forex Trading Strategies
- Open a FREE Trading Account


