GBP/USD Stalls at 1.2700 Ahead of FOMC Decision
The GBP/USD currency pair sees a slight uptick after a dip in the Asian market session on Monday, yet it remains within a narrow range
The GBP/USD currency pair sees a slight uptick after a dip in the Asian market session on Monday, yet it remains within a narrow range that has persisted for approximately two weeks. Currently, the exchange rate hovers around the 1.2700 level, with no significant change as market participants anticipate a clear directional signal.
FOMC: Monetary Policy Expectations and Market Impacts
All eyes are on the forthcoming FOMC meeting, starting Tuesday, where the central bank’s monetary policy decisions could set the stage for the Pound’s movement against the dollar. Friday’s data suggested a modest increase in US inflation for December, supporting projections of a mid-2024 rate cut by the Federal Reserve.
However, the positive turn in Personal Incomes and spending, alongside a strong US Q4 GDP, paints a picture of a robust economy, potentially limiting the Fed’s need for aggressive rate cuts. This scenario provides a backdrop that may restrain the GBP/USD pair from climbing.
Market sentiment is somewhat cautious, reflected in the dampened vibrancy of the equity markets, which props up the USD as a haven, especially after it reached its highest point since mid-December last week. Nonetheless, expectations of a modest economic rebound in the UK and delayed policy easing by the BoE offer some support for the Pound.
The market’s current hesitation suggests a wait-and-see approach, particularly with no significant UK or US economic data slated for release on Monday. Investors will likely adopt a cautious stance, awaiting the outcomes of central bank meetings and key US economic figures, including the Nonfarm Payrolls due later in the week.
GBP/USD Technical Outlook
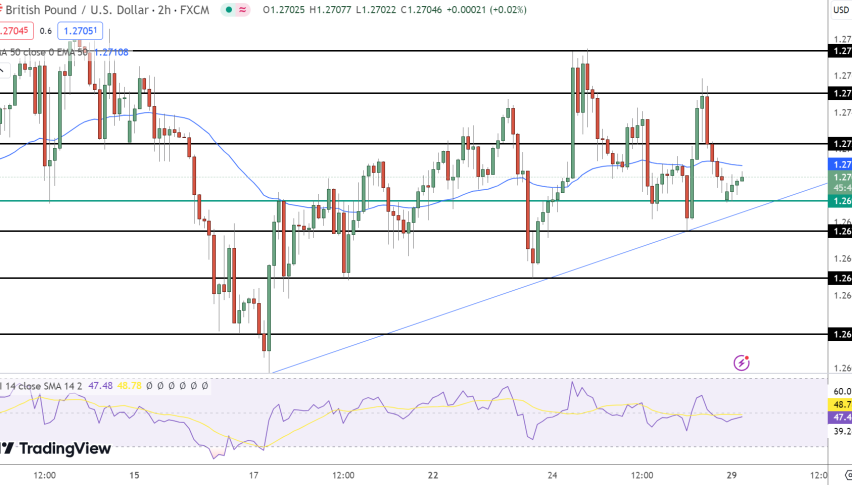
In the currency markets, the GBP/USD pair is currently hovering around a pivot point marked by the green line, set at 1.2691. This level represents a threshold where the balance of forex market sentiment is measured.
Below this pivot, three support levels emerge at 1.2691, 1.2648, and 1.2617. These are potential floors where the Pound may find some buying interest to cushion further depreciation against the dollar. Above the pivot point, resistance levels are positioned at 1.2750, 1.2773, and 1.2780.
These levels could serve as ceilings, challenging the Pound’s attempts to ascend. A bearish flag pattern, visible in the 4-hour timeframe, hints at a continued downtrend, suggesting that the pair’s recent recovery may be short-lived.
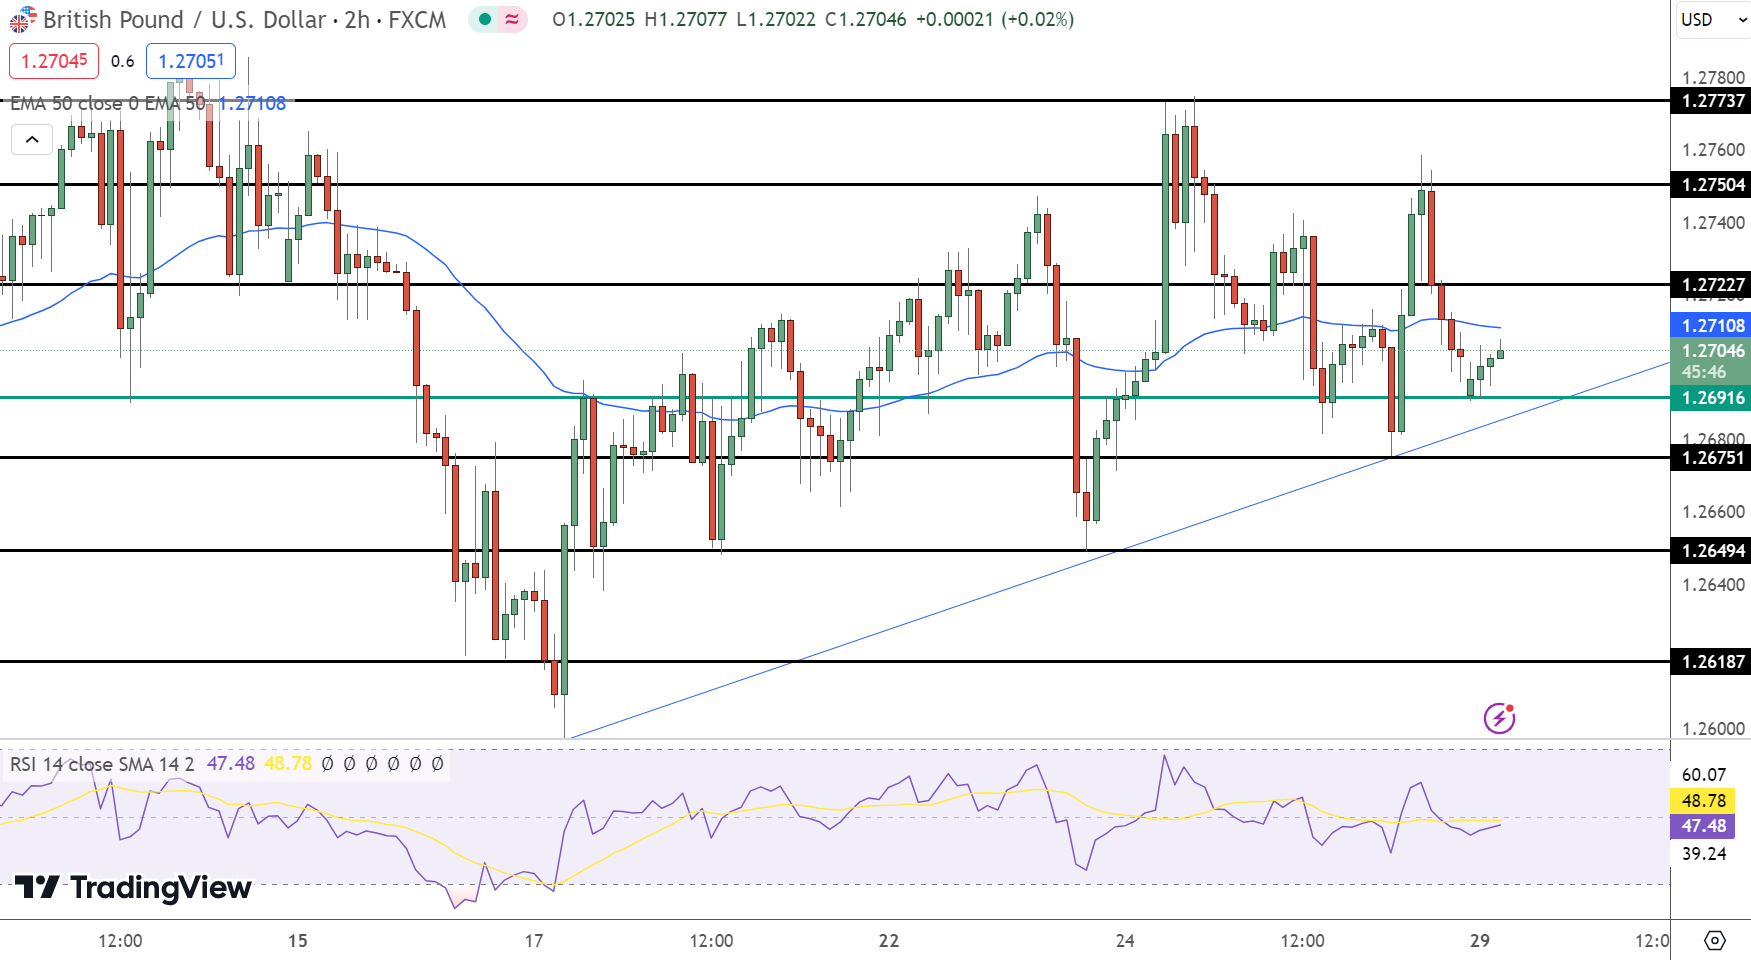
The Relative Strength Index (RSI), wavering around 48, indicates a market in balance, neither overbought nor oversold. The 50-period Exponential Moving Average (EMA) at 1.2770 provides additional resistance, aligning closely with the upper resistance level.
Taken together, the technical indicators—the pivot point, support and resistance levels, RSI, and EMA—point towards a prevailing bearish trend for the GBP/USD pair, signalling caution among Pound bulls. So let’s wait for Sterling to break below 1.2691 to enter a sell trade and vice versa.
GBP/USD Live Chart
- Check out our free forex signals
- Follow the top economic events on FX Leaders economic calendar
- Trade better, discover more Forex Trading Strategies
- Open a FREE Trading Account
- Read our latest reviews on: Avatrade, Exness, HFM and XM
Related Articles

Sidebar rates
Related Posts
