AUD/USD Rises Ahead of US NFP, Despite Weak PPI
The AUD/USD pair has nudged higher, trading at 0.6590, as it moves past its year-to-date low of 0.6508. Despite the Australian Producer
The AUD/USD pair has nudged higher, trading at 0.6590, as it moves past its year-to-date low of 0.6508. Despite the Australian Producer Price Index (PPI) for Q4 coming in at 0.9%, underperforming against the forecasted 1.9%, the Australian Dollar has found footing. This resilience is partly due to market sentiment pricing in potential weakness in the US Dollar ahead of critical US Nonfarm Payroll (NFP) data.The currency’s modest ascent reflects a broader anticipation of the upcoming US Nonfarm Payrolls and unemployment rate figures, which are expected to underperform relative to previous reports.
With the market bracing for potentially softer US jobs data, the AUD/USD’s current position reflects investor adjustments for a possibly dovish stance by the Federal Reserve.
US Labor Market in Focus
The Nonfarm Payrolls and the unemployment rate, due to be released, are projected to unveil a less robust US job market, which could signal a slower pace of rate hikes and influence global currency valuations.
Forecasts predict 187K new jobs, a decrease from the previous 216K. Should the actual figures exceed expectations, indicating a robust job market, the Fed might slow its rate cuts, bolstering the USD and applying downward pressure on gold.
Alternatively, if the NFP falls short, suggesting economic cooling, the Fed could pursue a more aggressive rate-cut policy, potentially elevating the AUD/USD pair.
By balancing these scenarios, investors recognise the interplay between the anticipated earnings data and the unemployment rate forecast of 3.8%.
Investors will closely monitor these releases to inform their positions in a forex market sensitive to shifts in economic policy signals.
AUD/USD Price Outlook; Technical Analysis
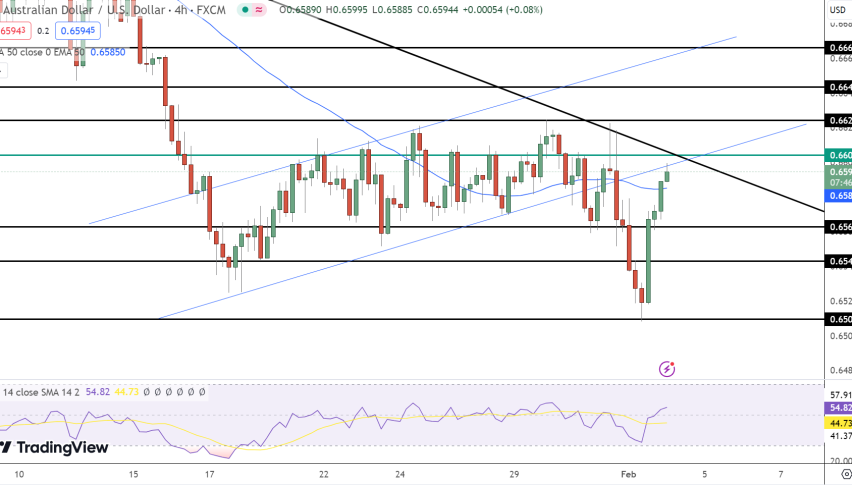
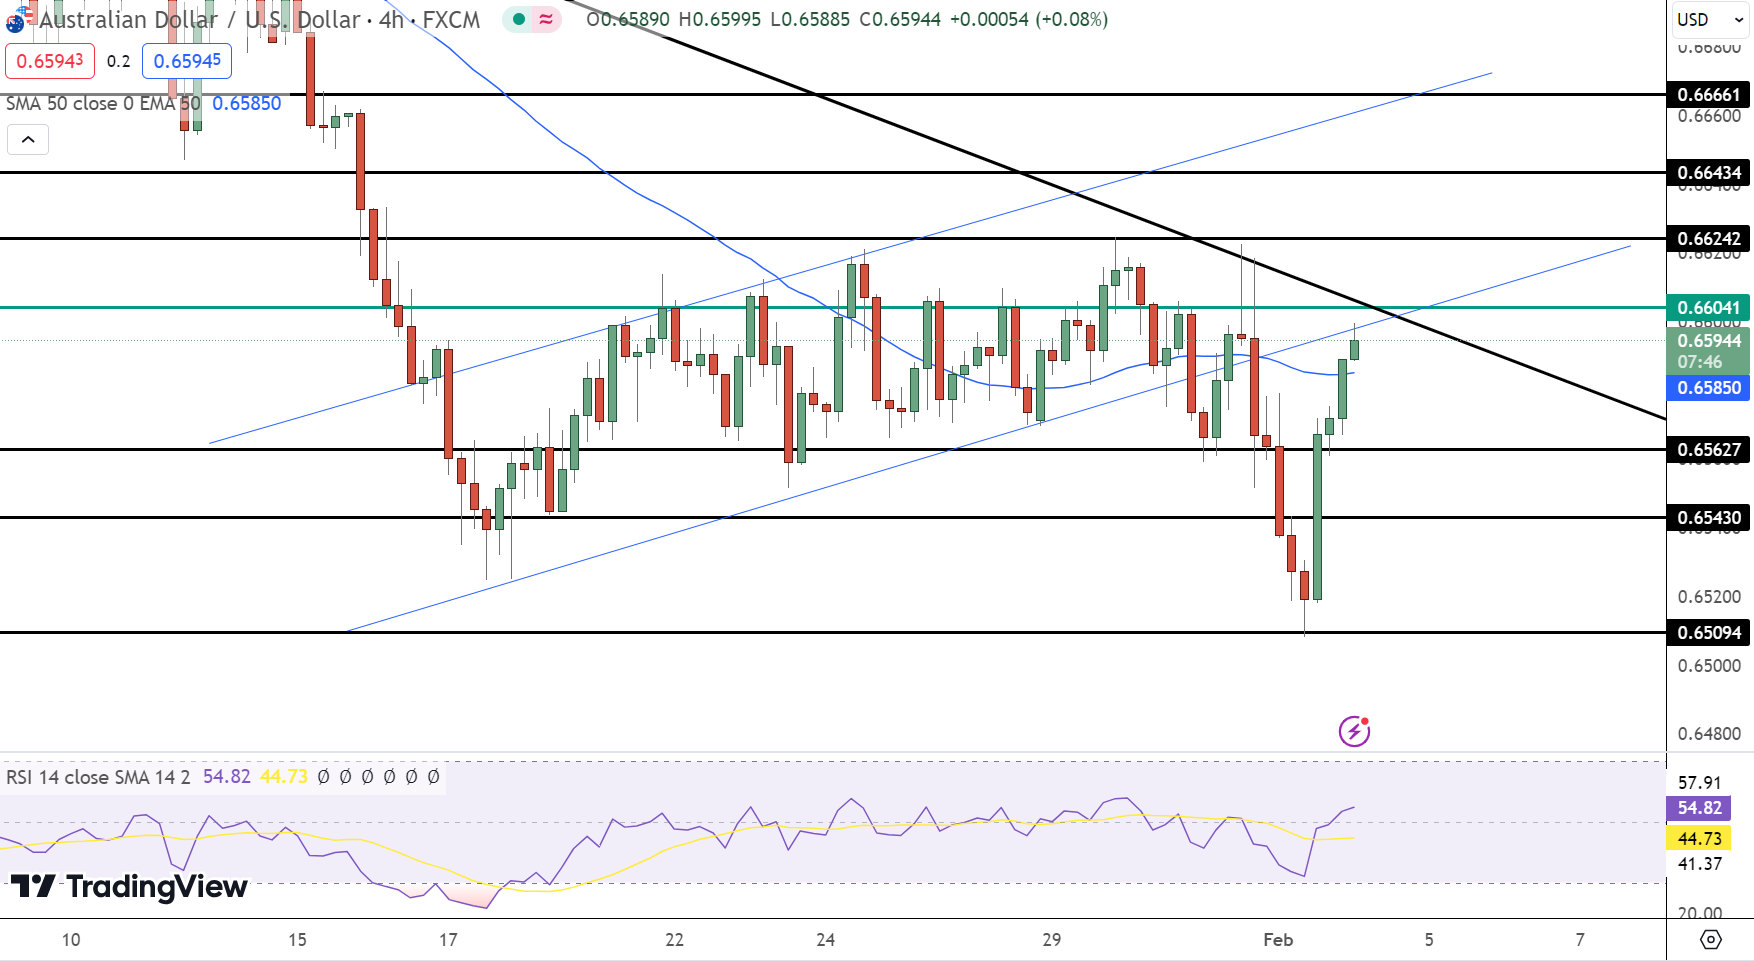
The Australian Dollar is trading against the US Dollar at $0.65944, reflecting a marginal increase. The 4-hour chart identifies the pivot point at $0.65850, which is closely tracked by traders for directional cues.
Immediate resistance for the AUD/USD is observed at $0.6604, with additional resistance levels at $0.66242 and $0.66434. Support, conversely, is found at $0.65627, with further safety nets at $0.65430 and lower levels not shown on the current chart.
The Relative Strength Index (RSI) sits at 44, indicating neutrality with a bearish bias. The 50-day Exponential Moving Average (EMA) aligns with the pivot point, potentially acting as a dynamic support or resistance.
- Check out our free forex signals
- Follow the top economic events on FX Leaders economic calendar
- Trade better, discover more Forex Trading Strategies
- Open a FREE Trading Account


