Gold Price Forecast: XAU/USD Dips to $2038; Stronger NFP Boosts Rate Cut Hopes
Gold (XAU/USD) trades with a slight bearish bias near $2032 in Monday's early Asian trading hours. The metal's progress
Gold (XAU/USD) trades with a slight bearish bias near $2032 in Monday’s early Asian trading hours. The metal’s progress is somewhat restrained by a robust US jobs report, which has tempered speculation around a March rate cut. Gold is trading at $2,038, up 0.12%, despite the more robust labor market potentially firming the dollar.
US Nonfarm Payrolls (NFP) Impacts Monetary Policy Expectations
Friday’s release of the US Nonfarm Payrolls (NFP), which exceeded expectations at 353K for January, has influenced the market’s view on Federal Reserve policy.
With the unemployment rate holding steady at 3.7% and average hourly earnings increasing by 4.5% year-over-year, the likelihood of an imminent rate cut has receded, casting a shadow over non-yielding gold.
Geopolitical Strains Underpin Gold’s Safe-Haven Status
Contrasting with domestic economic strength, intensifying geopolitical conflict in the Middle East could bolster gold’s safe-haven demand. Recent military strikes in Yemen by the US and UK, targeting Houthi positions, inject uncertainty that may underpin gold prices.
Investors await Federal Reserve Chair Jerome Powell’s upcoming speech and service sector data from both China and the US. These pivotal developments are expected to steer gold’s short-term trajectory as market participants gauge economic health against a backdrop of geopolitical risk.
Gold Price Forecast: Technical Outlook
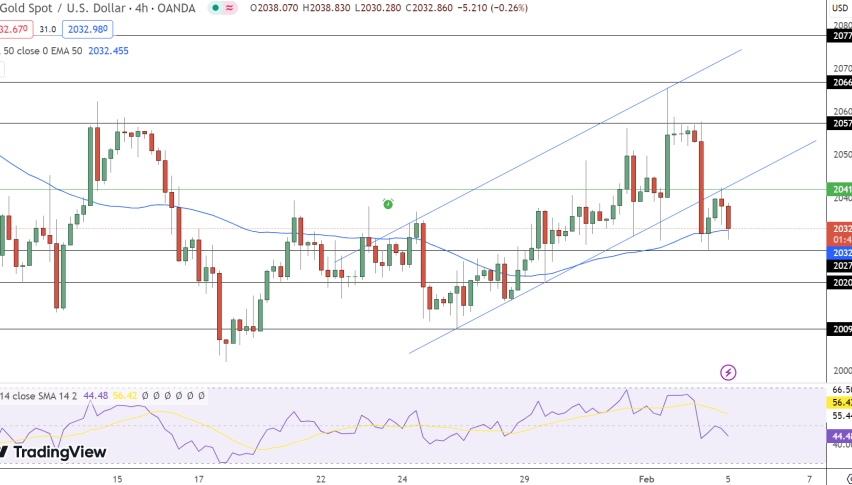
In the current session, gold has retreated, trading at $2032.67, marking a subtle shift from recent highs. The chart reveals the pivot point at $2041.96, now a critical resistance after gold breached an upward channel. This channel previously offered support around the $2040 level, currently serving as a hurdle for bullish attempts.
Immediate resistance is set just above the pivot at $2041.96, with further resistance levels likely found near recent highs and psychological round figures beyond. Support is initially seen at the session low of $2032.86, with additional lower supports potentially at round-number levels that have historically acted as consolidation points.
Gold XAU Live Chart
Gold Price Chart
The Relative Strength Index (RSI) hovers at 56, depicting neither overbought nor oversold conditions, suggesting room for movement in either direction before reaching an extreme. The 50-day Exponential Moving Average (EMA) is currently at $2032.455, further underscoring the significance of the $2030-2040 range as a battleground for short-term direction.
- Check out our free forex signals
- Follow the top economic events on FX Leaders economic calendar
- Trade better, discover more Forex Trading Strategies
- Open a FREE Trading Account
- Read our latest reviews on: Avatrade, Exness, HFM and XM
Related Articles


Sidebar rates
Related Posts
