WTI Crude Oil Holds Steady Amid Ceasefire Tensions and Supply Concerns
WTI crude oil prices stayed strong at around $74.20 per barrel, keeping up with the gains from the last four days. The prices
WTI crude oil prices stayed strong at around $74.20 per barrel, keeping up with the gains from the last four days. The prices saw a bit more action due to increased tensions from the Israel-Gaza conflict, making it harder to reach peace.
On another note, oil prices couldn’t climb any higher because there’s too much oil in storage, hinting at more supply than demand. Meanwhile, the US dollar didn’t move much, staying steady as people wait for new economic data from the US, which might slightly push oil prices down.
Impact of Ceasefire Efforts in Israel-Gaza on Oil Prices
Israel’s Prime Minister Benjamin Netanyahu turned down a ceasefire offer from Hamas, aiming for a complete win in Gaza, despite the US suggesting more discussions might happen. Despite talks of peace and proposals for a gradual ceasefire, including prisoner swaps and delivering aid, Netanyahu’s stance and ongoing violence could make oil prices volatile. Conflicts in this region often shake up the oil market due to worries about supply disruptions.
Oil Supply Reports and Their Effects
Recent reports showed a small increase in US oil stocks, less than expected, which usually would boost oil prices. However, the US Energy Information Administration (EIA) reported a significant rise in oil stockpiles, higher than forecasts, which slowed down the price increase.
The EIA also adjusted its forecast, expecting US oil production growth to slow down next year. This change is part of what’s driving oil prices up as the market reacts to the supply and demand dynamics.
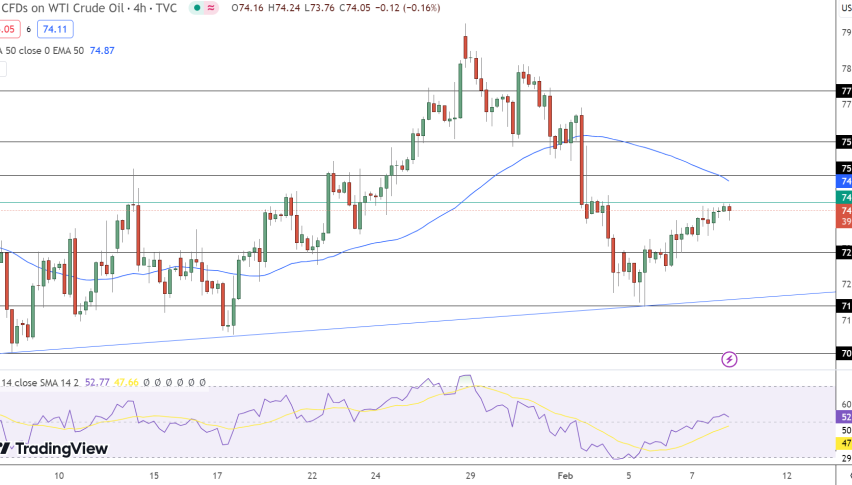
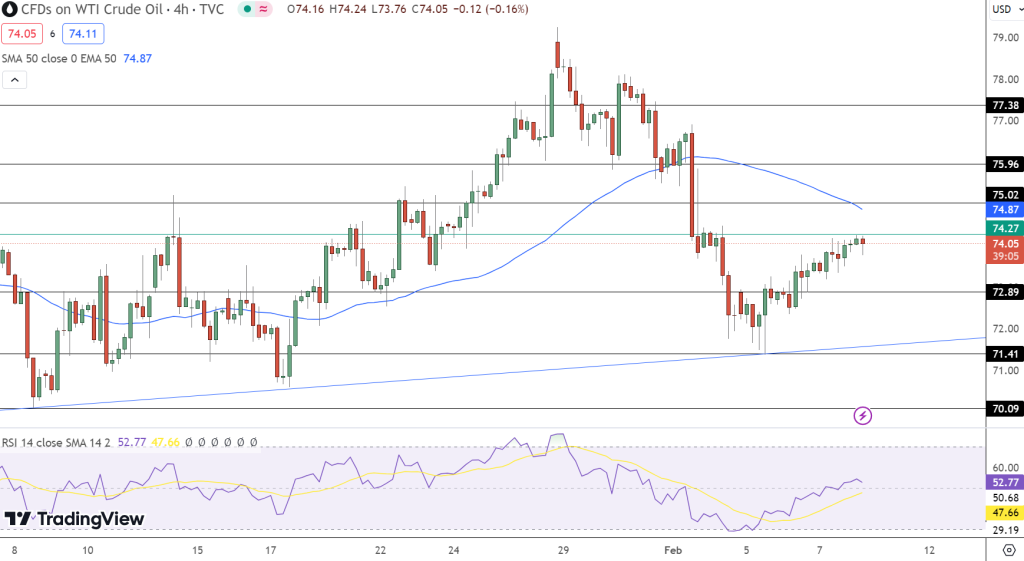
WTI Crude Oil Forecast: Technical Outlook
USOil’s technical outlook on February 8 indicates a delicate balance in market dynamics, with a slight increase of 0.06%, positioning the commodity at $74.06. This minor uptick is set against fluctuating energy markets, where supply concerns and geopolitical tensions often sway prices. The pivot point, established at $74.27, is a critical threshold that could dictate the day’s trading direction.
Resistance levels are identified at $75.02, $75.96, and $77.38, each presenting potential ceilings for price escalations. Conversely, support is found at $72.89, followed by $71.41 and $70.09, offering floors that might halt any downward trends.
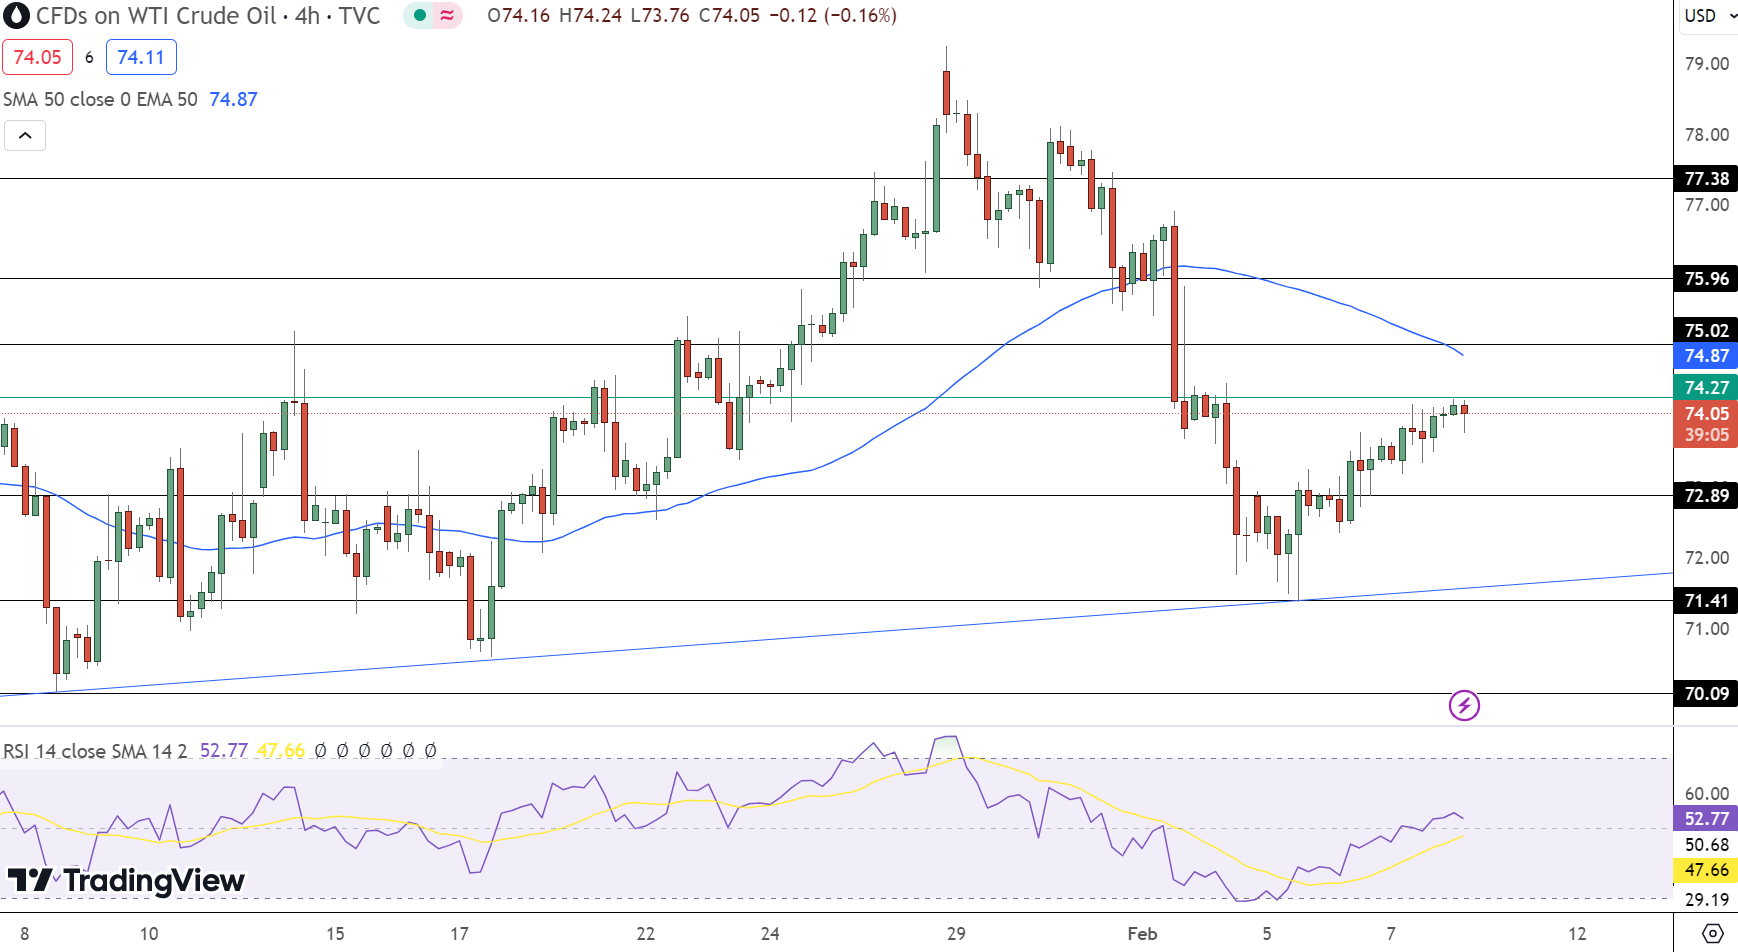
The Relative Strength Index (RSI) at 52 suggests a market in equilibrium, neither overbought nor oversold, indicating potential for movement in either direction. Additionally, the 50-day Exponential Moving Average (EMA) at $74.87 suggests a slight bearish tilt, as current prices hover below this indicator.
- Check out our free forex signals
- Follow the top economic events on FX Leaders economic calendar
- Trade better, discover more Forex Trading Strategies
- Open a FREE Trading Account
- Read our latest reviews on: Avatrade, Exness, HFM and XM
Related Articles


Sidebar rates
Related Posts
