USD/JPY Price Forecast: 150.78 Amid Surging US Treasury Yields & Inflation Data
The USD/JPY pair ascended to a three-month zenith of 150.81 following the US Bureau of Labor Statistics' disclosure that US inflation
The USD/JPY pair ascended to a three-month zenith of 150.81 following the US Bureau of Labor Statistics’ disclosure that US inflation persists above the 3% mark, albeit at a decelerating pace. The pair is trading at 150.78, reflecting a 0.96% increase.
US Inflation and Treasury Yields: A Catalyst for USD/JPY
The latest CPI data has stirred the financial markets, revealing a January increase of 3.1% year-over-year, slightly below the previous 3.4% yet above the anticipated 2.9%.
The Core CPI, excluding food and energy, remained stable at 3.9% year-over-year, surpassing the 3.7% forecast. This inflationary pressure has propelled US Treasury yields upward, with the 10-year note reaching 4.314%, a rise of over 13 basis points.
This surge has significantly reduced expectations for an imminent Federal Reserve rate cut, further boosting the USD/JPY pair beyond the 150.00 milestone.
Monetary Policy Outlook: Fed and BoJ Perspectives
Market expectations have adjusted, with the CME FedWatch Tool indicating a diminished likelihood of rate cuts in March and May, while June sees a slight uptick in expectations. Consequently, the federal funds rate is projected to stay within the 5.25%-5.50% range for the initial months 2024.
On the other hand, the Bank of Japan presents an ambiguous outlook on its monetary policy direction. Recent data, including a significant -14.1% year-over-year drop in Machinery Orders and a consistent 0.2% Producer Price Index, suggest a cautious stance towards adjusting the negative interest rate policy, pending sustainable inflation above the 2% target.
This complex interplay of US inflation data and monetary policy adjustments in both the US and Japan shapes the trajectory of the USD/JPY pair, hinting at continued volatility and strategic positioning among investors.
USD/JPY Technical Analysis: Navigating Market Sentiment
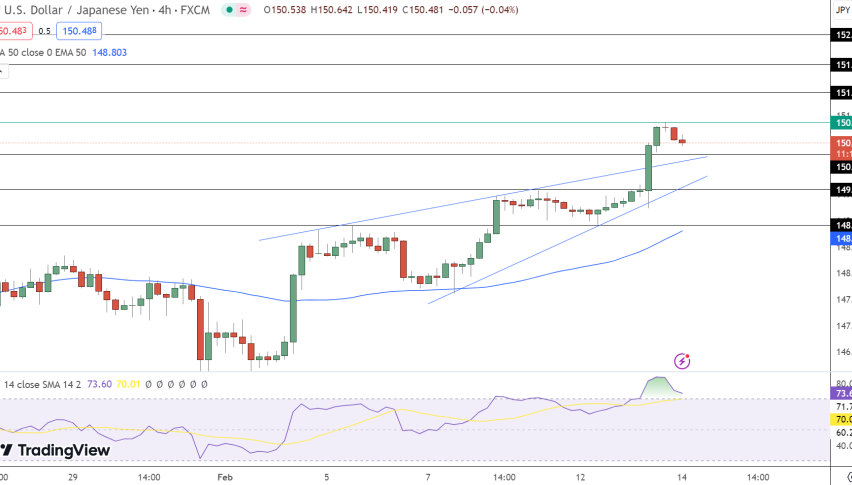
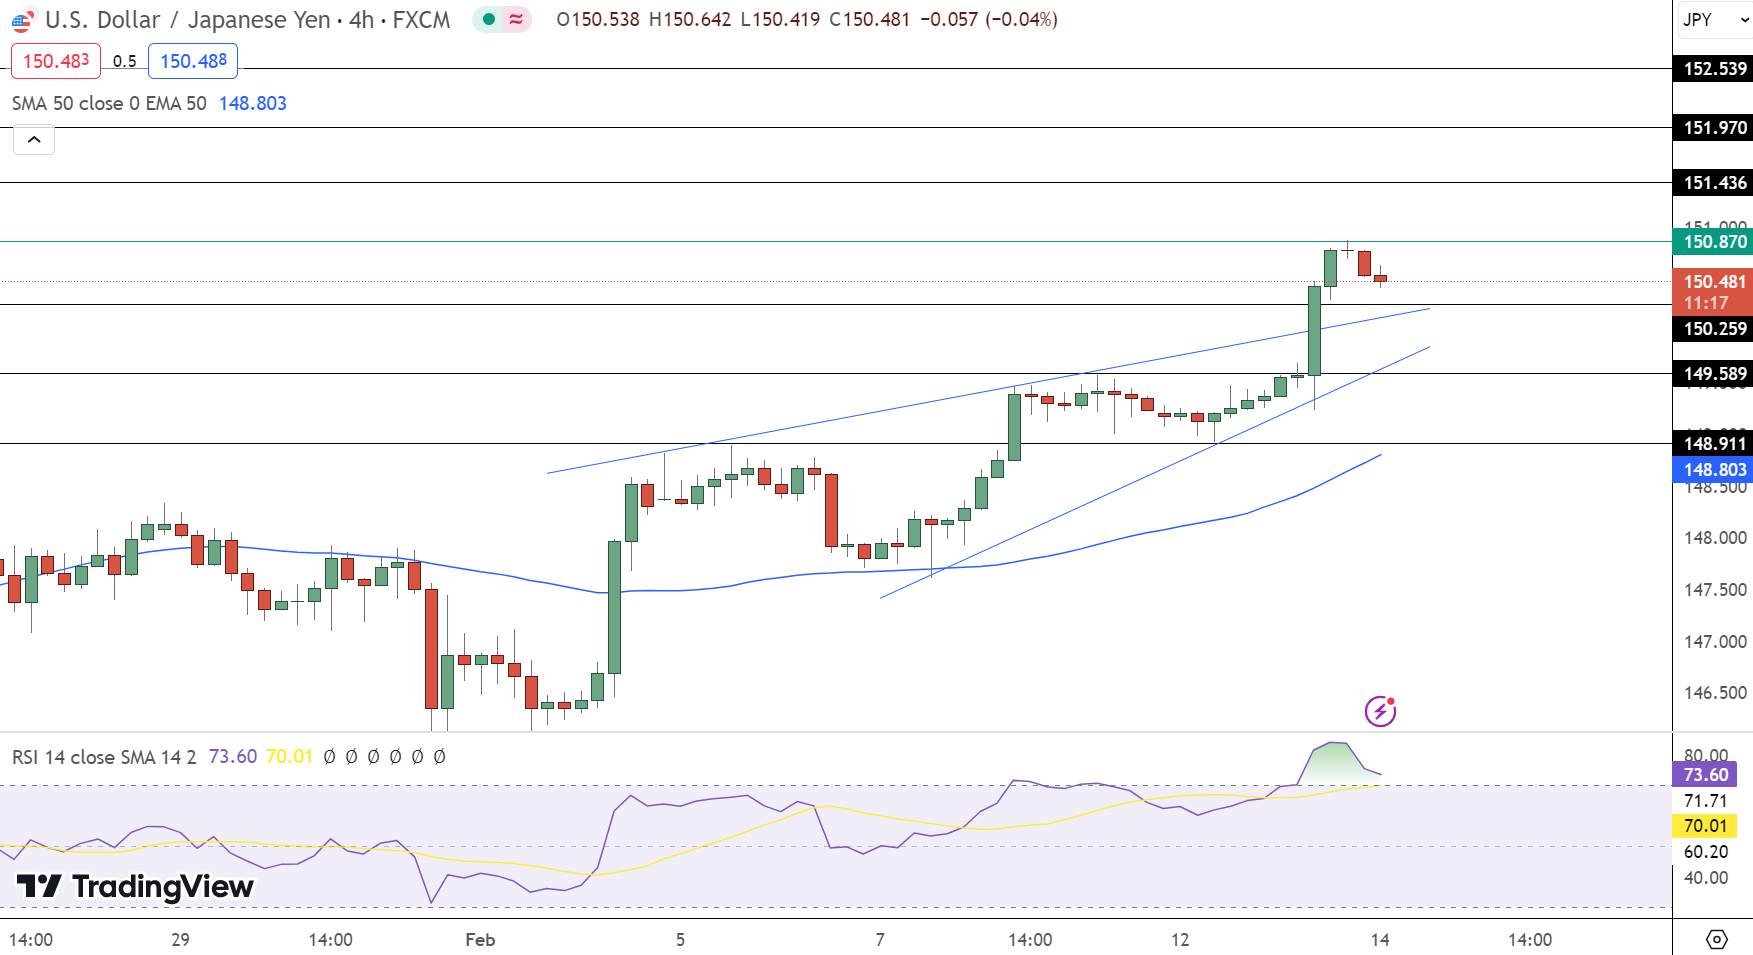
On February 14, the USD/JPY pair experienced a slight decline, trading at 150.468, marking a 0.20% decrease. Positioned below its pivot point of 150.870, the currency pair faces immediate resistance levels at 151.436, 151.970, and 152.539, which could indicate potential upward movement if surpassed.
Conversely, support is found at 150.259, followed by 149.589 and 148.911, serving as crucial thresholds to stave off further losses.
With the Relative Strength Index (RSI) at 73, suggesting overbought conditions, and the 50-day Exponential Moving Average (EMA) at 148.803, the market sentiment tilts towards a bearish stance below the 150.870 level.
- Check out our free forex signals
- Follow the top economic events on FX Leaders economic calendar
- Trade better, discover more Forex Trading Strategies
- Open a FREE Trading Account


