Gold Price Outlook: Fed’s Rate Speculation and Dollar Strength Jostle Market
Gold's market value experienced a slight decrease on Tuesday, settling close to $2,018 per ounce in the Asian trading session,

Gold’s market value experienced a slight decrease on Tuesday, settling close to $2,018 per ounce in the Asian trading session, following a halt in its recent upward trend. Due to an increasing US dollar and rising US bond yields, the precious metal faced challenges.
This rise in yields has placed downward pressure on gold, a non-yielding asset, affecting its attractiveness to investors.
Anticipation of Federal Reserve’s Monetary Policy Insights
Investors are on the edge of their seats awaiting the minutes of the Federal Open Market Committee (FOMC) meeting due for release on Wednesday. These minutes are highly anticipated as they could shed light on the Federal Reserve’s outlook on interest rate adjustments, offering valuable cues to market participants about the future direction of monetary policy.
Fed’s Rate Cut Projections and Dollar’s Response
ANZ’s prediction points towards the Federal Reserve embarking on a rate-cutting journey starting July 2024, with the CME FedWatch Tool indicating a 53% chance of a 25 basis point reduction by June.
Recent dovish statements from Fed officials, including San Francisco’s Mary C. Daly advocating for three rate cuts in 2024, and St. Louis’ James Bullard suggesting a potential rate decrease in March, have dented the US dollar’s strength.
Conversely, the US Dollar Index (DXY) found some footing, breaking a four-day downward trend by trading higher at approximately 104.40.
The bond market reflects this sentiment, with 2-year and 10-year US bond yields currently at 4.65% and 4.30%, respectively, signalling investors’ recalibrated expectations for interest rates and their impact on gold prices.
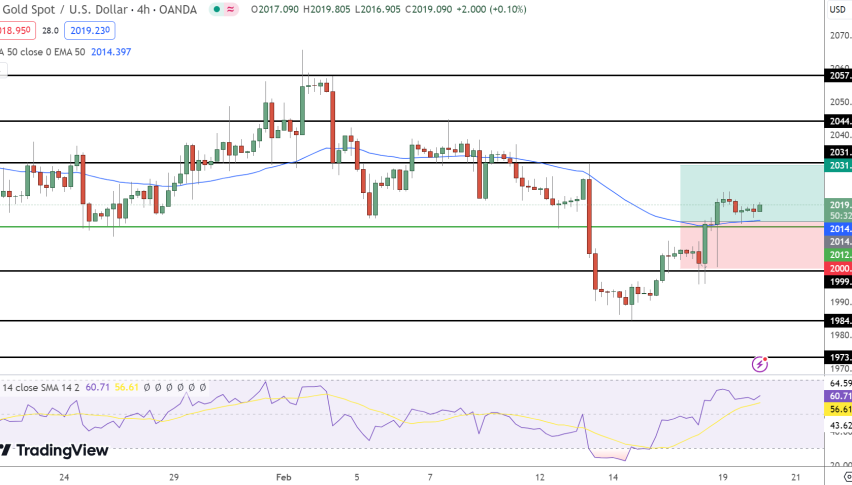
Gold Price Forecast: Technical Outlook
In today’s financial markets, GOLD has seen a slight uptick of 0.03%, reaching $2,018.25. The metal’s movements are closely watched, with a pivot point established at $2,009.50, suggesting a cautiously optimistic sentiment.
Resistance levels are set at $2,034.19, $2,056.33, and $2,083.57, indicating potential upside targets. Conversely, support levels at $1,987.36, $1,963.52, and $1,939.68 offer a safety net against downward trends.
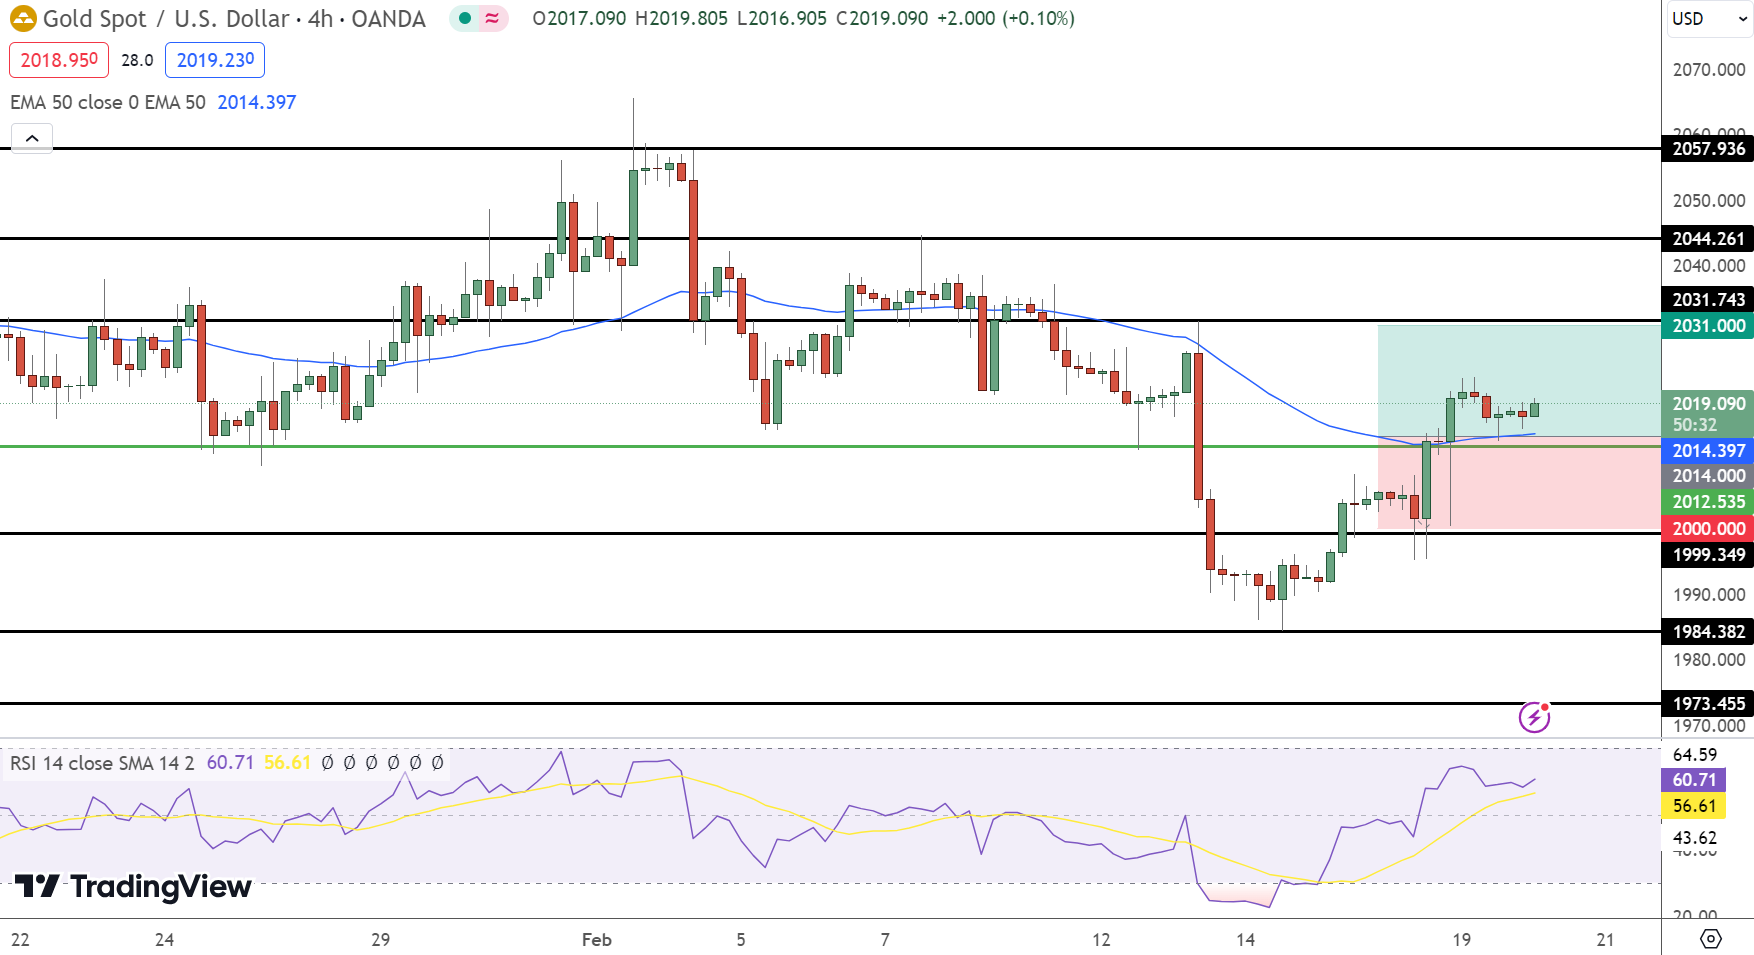
The Relative Strength Index (RSI) at 59, coupled with a MACD value of 1.66 below its signal of 2.74, hints at burgeoning momentum.
Furthermore, the 50-day Exponential Moving Average (EMA) at $2,016.16 underpins a bullish outlook, suggesting that gold could maintain its ascent if it remains above this critical threshold.
- Check out our free forex signals
- Follow the top economic events on FX Leaders economic calendar
- Trade better, discover more Forex Trading Strategies
- Open a FREE Trading Account
- Read our latest reviews on: Avatrade, Exness, HFM and XM
Related Articles


Sidebar rates
Related Posts
