Polkadot (DOT) Tests $10: Decentralization Push and Bullish Technicals Fuel Investor Interest
Polkadot (DOT) surged past the significant $10 milestone on Monday, before sliding lower, in a move fueled by a combination of the project's
Polkadot (DOT) surged past the significant $10 milestone on Monday, before sliding lower, in a move fueled by a combination of the project’s commitment to decentralization and strong technical indicators.
Polkadot’s Decentralization Efforts Attract Investors
In late 2023, Polkadot underwent a significant restructuring, delegating key non-engineering functions to its community through its decentralized governance system, Polkassembly. This move, while leading to staff reductions, underscored the project’s dedication to a truly decentralized future, which has resonated with investors seeking a more community-driven approach.
DOT Outpaces Competitors in Recent Rally
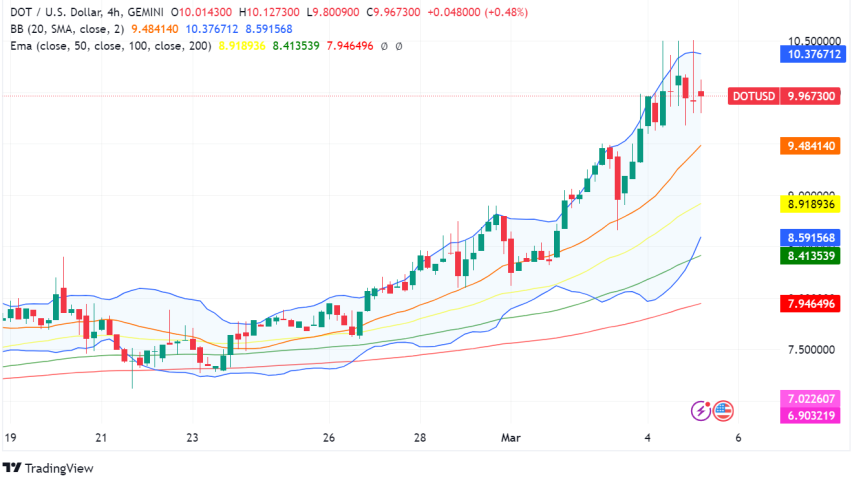
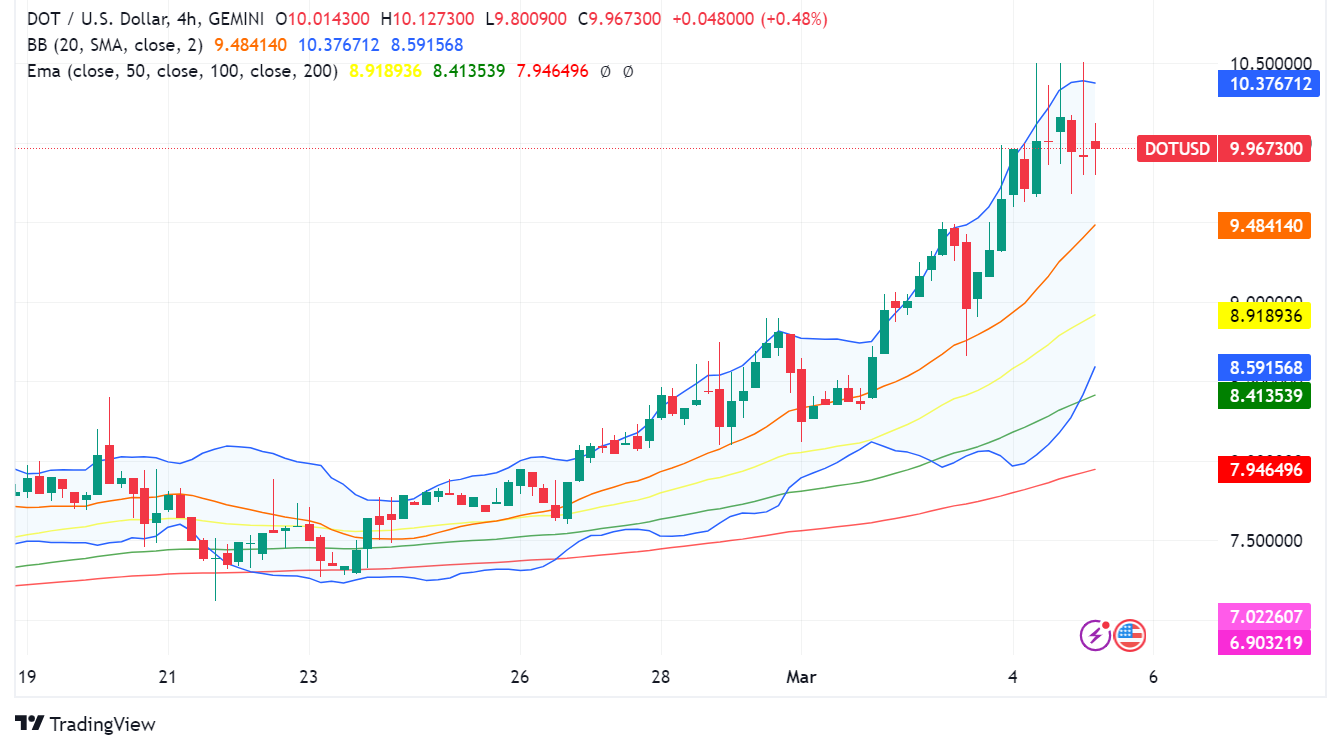
DOT’s recent price surge has been impressive. After establishing a solid base above $7.50, the token experienced a rapid 25% increase, temporarily outperforming both Ethereum and Bitcoin. Investors are now eyeing the $10.1 resistance level, a crucial hurdle for further gains.
DOT/USD Technical Analysis Suggests Continued Bullish Momentum
Technical indicators support the bullish sentiment surrounding DOT. The Moving Average Convergence Divergence (MACD) indicator suggests momentum is in the bullish zone, while the Relative Strength Index (RSI) sits comfortably above 50, indicating continued positive momentum.
Key Technical Levels for Traders
- Resistance: $10.1 (critical barrier for further upward movement)
- Support: $9.20 (key bullish trend line on the 4-hour chart)
- Moving Averages: 100-day Simple Moving Average (4-hour chart) currently sits below $9, indicating an overall uptrend.
Overall, Polkadot’s push towards decentralization and its recent technical performance have combined to create a compelling opportunity for investors. Traders should closely monitor the $10.1 resistance level and the $9.20 support line for potential breakout or breakdown scenarios.
- Check out our free forex signals
- Follow the top economic events on FX Leaders economic calendar
- Trade better, discover more Forex Trading Strategies
- Open a FREE Trading Account
- Read our latest reviews on: Avatrade, Exness, HFM and XM
Related Articles
Sidebar rates
Related Posts
