Crude Oil Dips Amid US Supply Caution & Global Demand Woes; ECB Decision Awaited
Oil prices are on the decline this Thursday, with noticeable drops in both Brent and WTI indices, following the US Energy Department's
Crude Oil price is trading at at $78.63, marking a decrease of 0.52%, with noticeable drops in both Brent and WTI indices, following the US Energy Department’s unexpectedly modest solicitation for only 3 million barrels. This quantity is particularly small in comparison to the United States’ production capacity, signaling a possible downturn in demand.
A parallel situation unfolds in the European gas sector, where demand lethargy is driving prices down. The European Union’s decreased need for gas replenishment ahead of the upcoming heating season further exacerbates this trend.
The US Dollar Index (DXY) has reached a new monthly low, influenced by Federal Reserve Chairman Jerome Powell’s announcement to the US Congress of impending rate cuts within the year. This revelation has bridged the interest rate gap between the US Dollar and other major currencies, resulting in a marked devaluation of the Dollar.
As attention shifts towards Europe, market participants eagerly await the European Central Bank’s (ECB) forthcoming rate decision and press briefing, hopeful for hints regarding the timing of rate reductions in the Eurozone.
In related news, the US Energy Department’s strategic oil reserve acquisitions have been relatively conservative this year, with only 26.28 million barrels purchased to date and plans to procure a mere additional 3 million barrels by September. This cautious approach may reflect subdued demand expectations for the near future. Additionally, BP Plc. has announced plans to curtail crude production at its German refineries by 2025, citing diminishing regional demand as the primary rationale.
The Energy Information Administration (EIA) reported a slight increase in crude stockpiles, with inventories rising by 1.37 million barrels last Wednesday. Conversely, tanker companies have noted a surge in bookings from China, indicative of a renewed interest in crude imports from the Persian Gulf, coinciding with a revival in leisure and air travel across China and Asia at large.
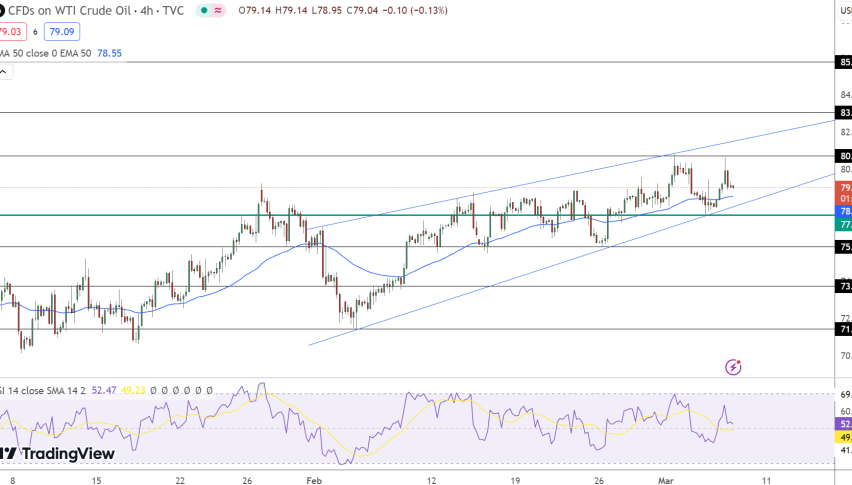
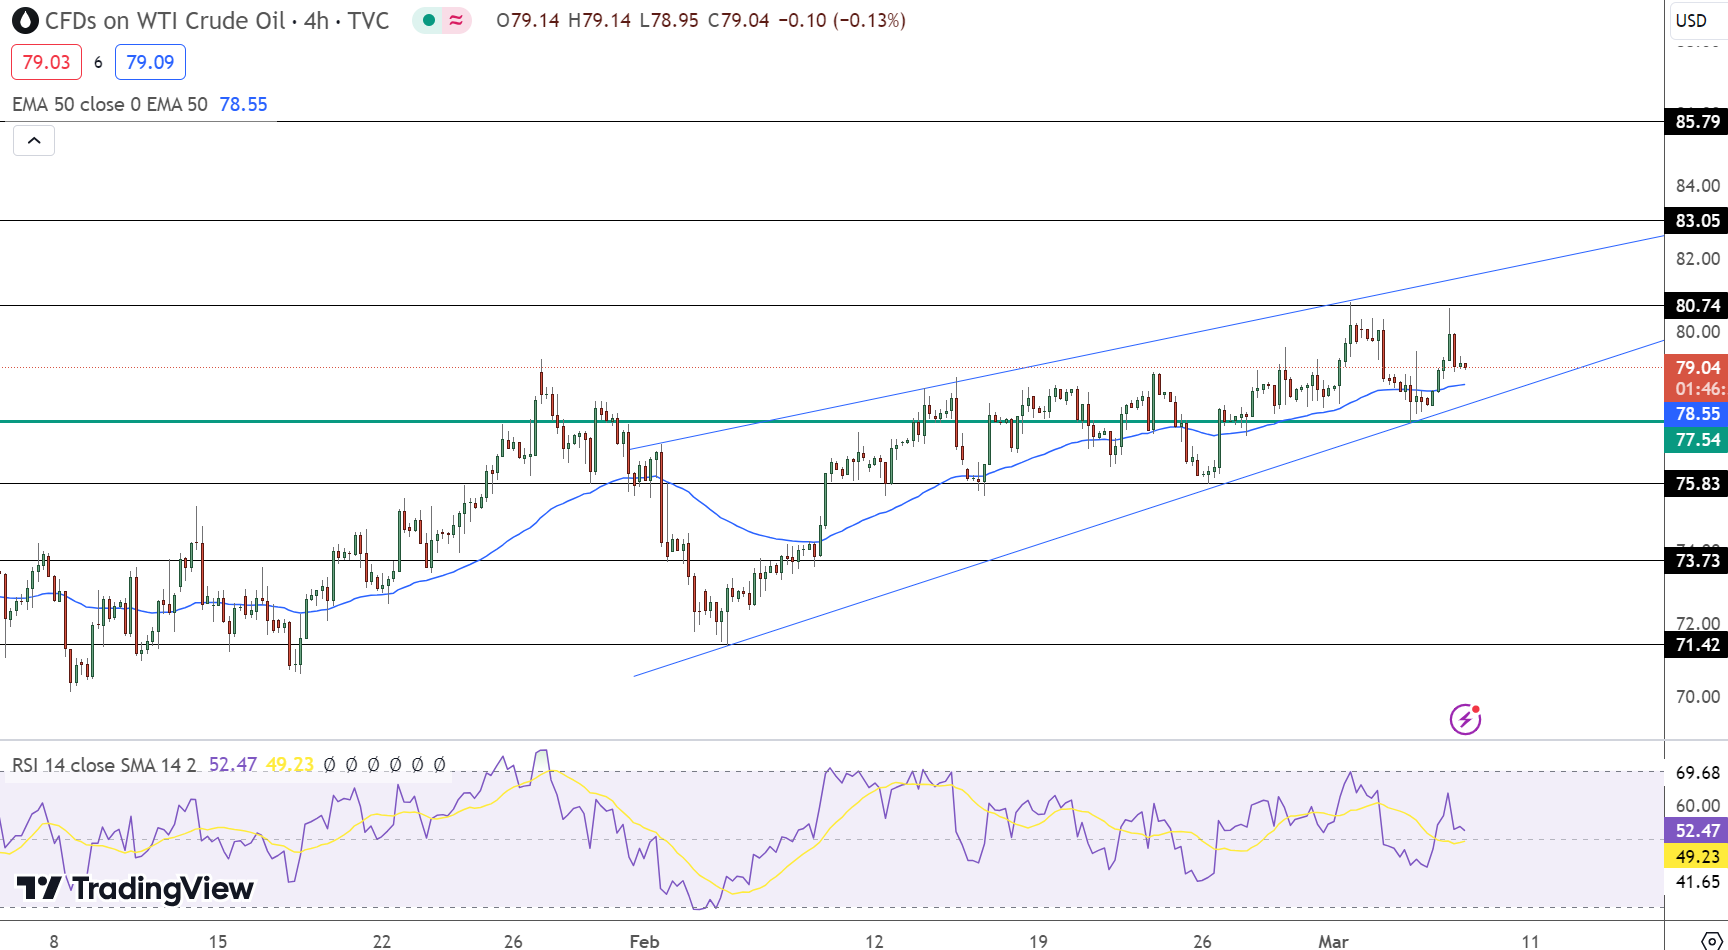
Crude Oil (USOIL) Price Forecast: Technical Outlook
Crude Oil’s trading dynamics on March 7 present a nuanced picture, with the price at $78.63, marking a decrease of 0.52%.
The four-hour chart reveals critical technical thresholds: a pivot point at $77.54 underpins immediate support and resistance levels, setting the stage for potential volatility.
Resistance lines are drawn at $80.74, $83.05, and $85.79, suggesting areas where sellers might converge.
Conversely, support levels at $75.83, $73.73, and $71.42 highlight potential buying zones. The Relative Strength Index (RSI) at 52, paired with a 50-Day Exponential Moving Average (EMA) closely aligned at $78.55, signals a market in equilibrium, yet teetering on the edge of further movement.
- Check out our free forex signals
- Follow the top economic events on FX Leaders economic calendar
- Trade better, discover more Forex Trading Strategies
- Open a FREE Trading Account
- Read our latest reviews on: Avatrade, Exness, HFM and XM
Related Articles


Sidebar rates
Related Posts
