Gold Price Forecast: XAU/USD Steady Above $2,175; Time to Buy Now?
In a fluctuating market, the price of gold (XAU/USD) finds support, climbing from its overnight peak of $2,200 amid a softening US Dollar.
•
Last updated: Wednesday, March 27, 2024

In a fluctuating market, the price of gold (XAU/USD) finds support, climbing from its overnight peak of $2,200 amid a softening US Dollar. Despite an initial boost from a lower Dollar at Wall Street’s open, an uptick in the Dollar’s recovery alongside a dip in US Treasury yields kept gold’s momentum positive.

Key Economic Indicators Influence Gold’s Trajectory
The US economic landscape delivered mixed signals, with Durable Goods Orders for February surpassing expectations, marking the highest leap since 2022.
However, the Conference Board’s Consumer Confidence Index dipped in March to a four-month low, reflecting ongoing concerns over inflation and rising borrowing costs. This mixed economic data plays a crucial role in gold price predictions, as investors weigh the implications of consumer sentiment and manufacturing strength on the market.
Fed’s Policy Outlook and Its Impact on Gold Prices
Amidst the Federal Reserve’s deliberations on interest rates, divisions within the FOMC come to light. While some officials anticipate rate cuts to combat inflation risks, the market’s anticipation of the Fed’s moves remains high.
Traders now eye the Core Personal Consumption Expenditure (PCE) Price Index, the Fed’s preferred inflation measure, for further clues. Expected to show moderated growth, this data could significantly influence gold’s value and the broader financial market.
Gold Market Awaits PCE Price Index Release
- Durable Goods Orders signal economic resilience, influencing gold’s value.
- Consumer Confidence Index sheds light on economic sentiment’s effect on gold prices.
- Fed’s rate decision speculation underscores gold market volatility.
As gold traders await the Core PCE Price Index, the outcome will undoubtedly shape the XAU/USD price forecast, offering insights into future market directions amid ongoing economic and monetary policy development.
Gold Price Forecast
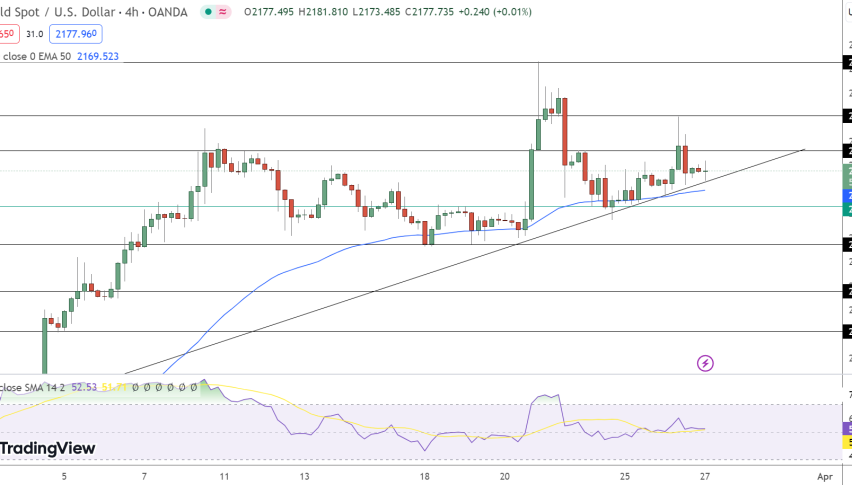
Gold’s technical posture strengthens as its price hovers around $2,177.74, showcasing resilience. The pivot point at $2,162.94 serves as a foundation for the day’s trading dynamics, suggesting a bullish sentiment as long as prices remain above this threshold.
Resistance markers are set at $2,185.92, $2,200.57, and $2,222.78, delineating potential hurdles for upward movement. Conversely, support levels at $2,147.03, $2,127.69, and $2,110.93 offer safety nets against downturns.

The Relative Strength Index (RSI) at 52 and the 50-day Exponential Moving Average (EMA) at $2,169.52 bolster a positive outlook, pointing to sustained upward momentum.
Gold’s trajectory remains bullish above $2,162, with any dip below signalling a potential shift in market dynamics.
- Check out our free forex signals
- Follow the top economic events on FX Leaders economic calendar
- Trade better, discover more Forex Trading Strategies
- Open a FREE Trading Account
ABOUT THE AUTHOR
See More
Arslan Butt
Lead Markets Analyst – Multi-Asset (FX, Commodities, Crypto)
Arslan Butt serves as the Lead Commodities and Indices Analyst, bringing a wealth of expertise to the field. With an MBA in Behavioral Finance and active progress towards a Ph.D., Arslan possesses a deep understanding of market dynamics.
His professional journey includes a significant role as a senior analyst at a leading brokerage firm, complementing his extensive experience as a market analyst and day trader. Adept in educating others, Arslan has a commendable track record as an instructor and public speaker.
His incisive analyses, particularly within the realms of cryptocurrency and forex markets, are showcased across esteemed financial publications such as ForexCrunch, InsideBitcoins, and EconomyWatch, solidifying his reputation in the financial community.


