Market Correction: Predicting S&P 500 (SPX), Nasdaq Composite (IXIC), and DJIA (US30) Trends
The S&P 500 (SPX) has exited its previous upward trend channel by breaking below critical support levels. Let's take a look at technicals.

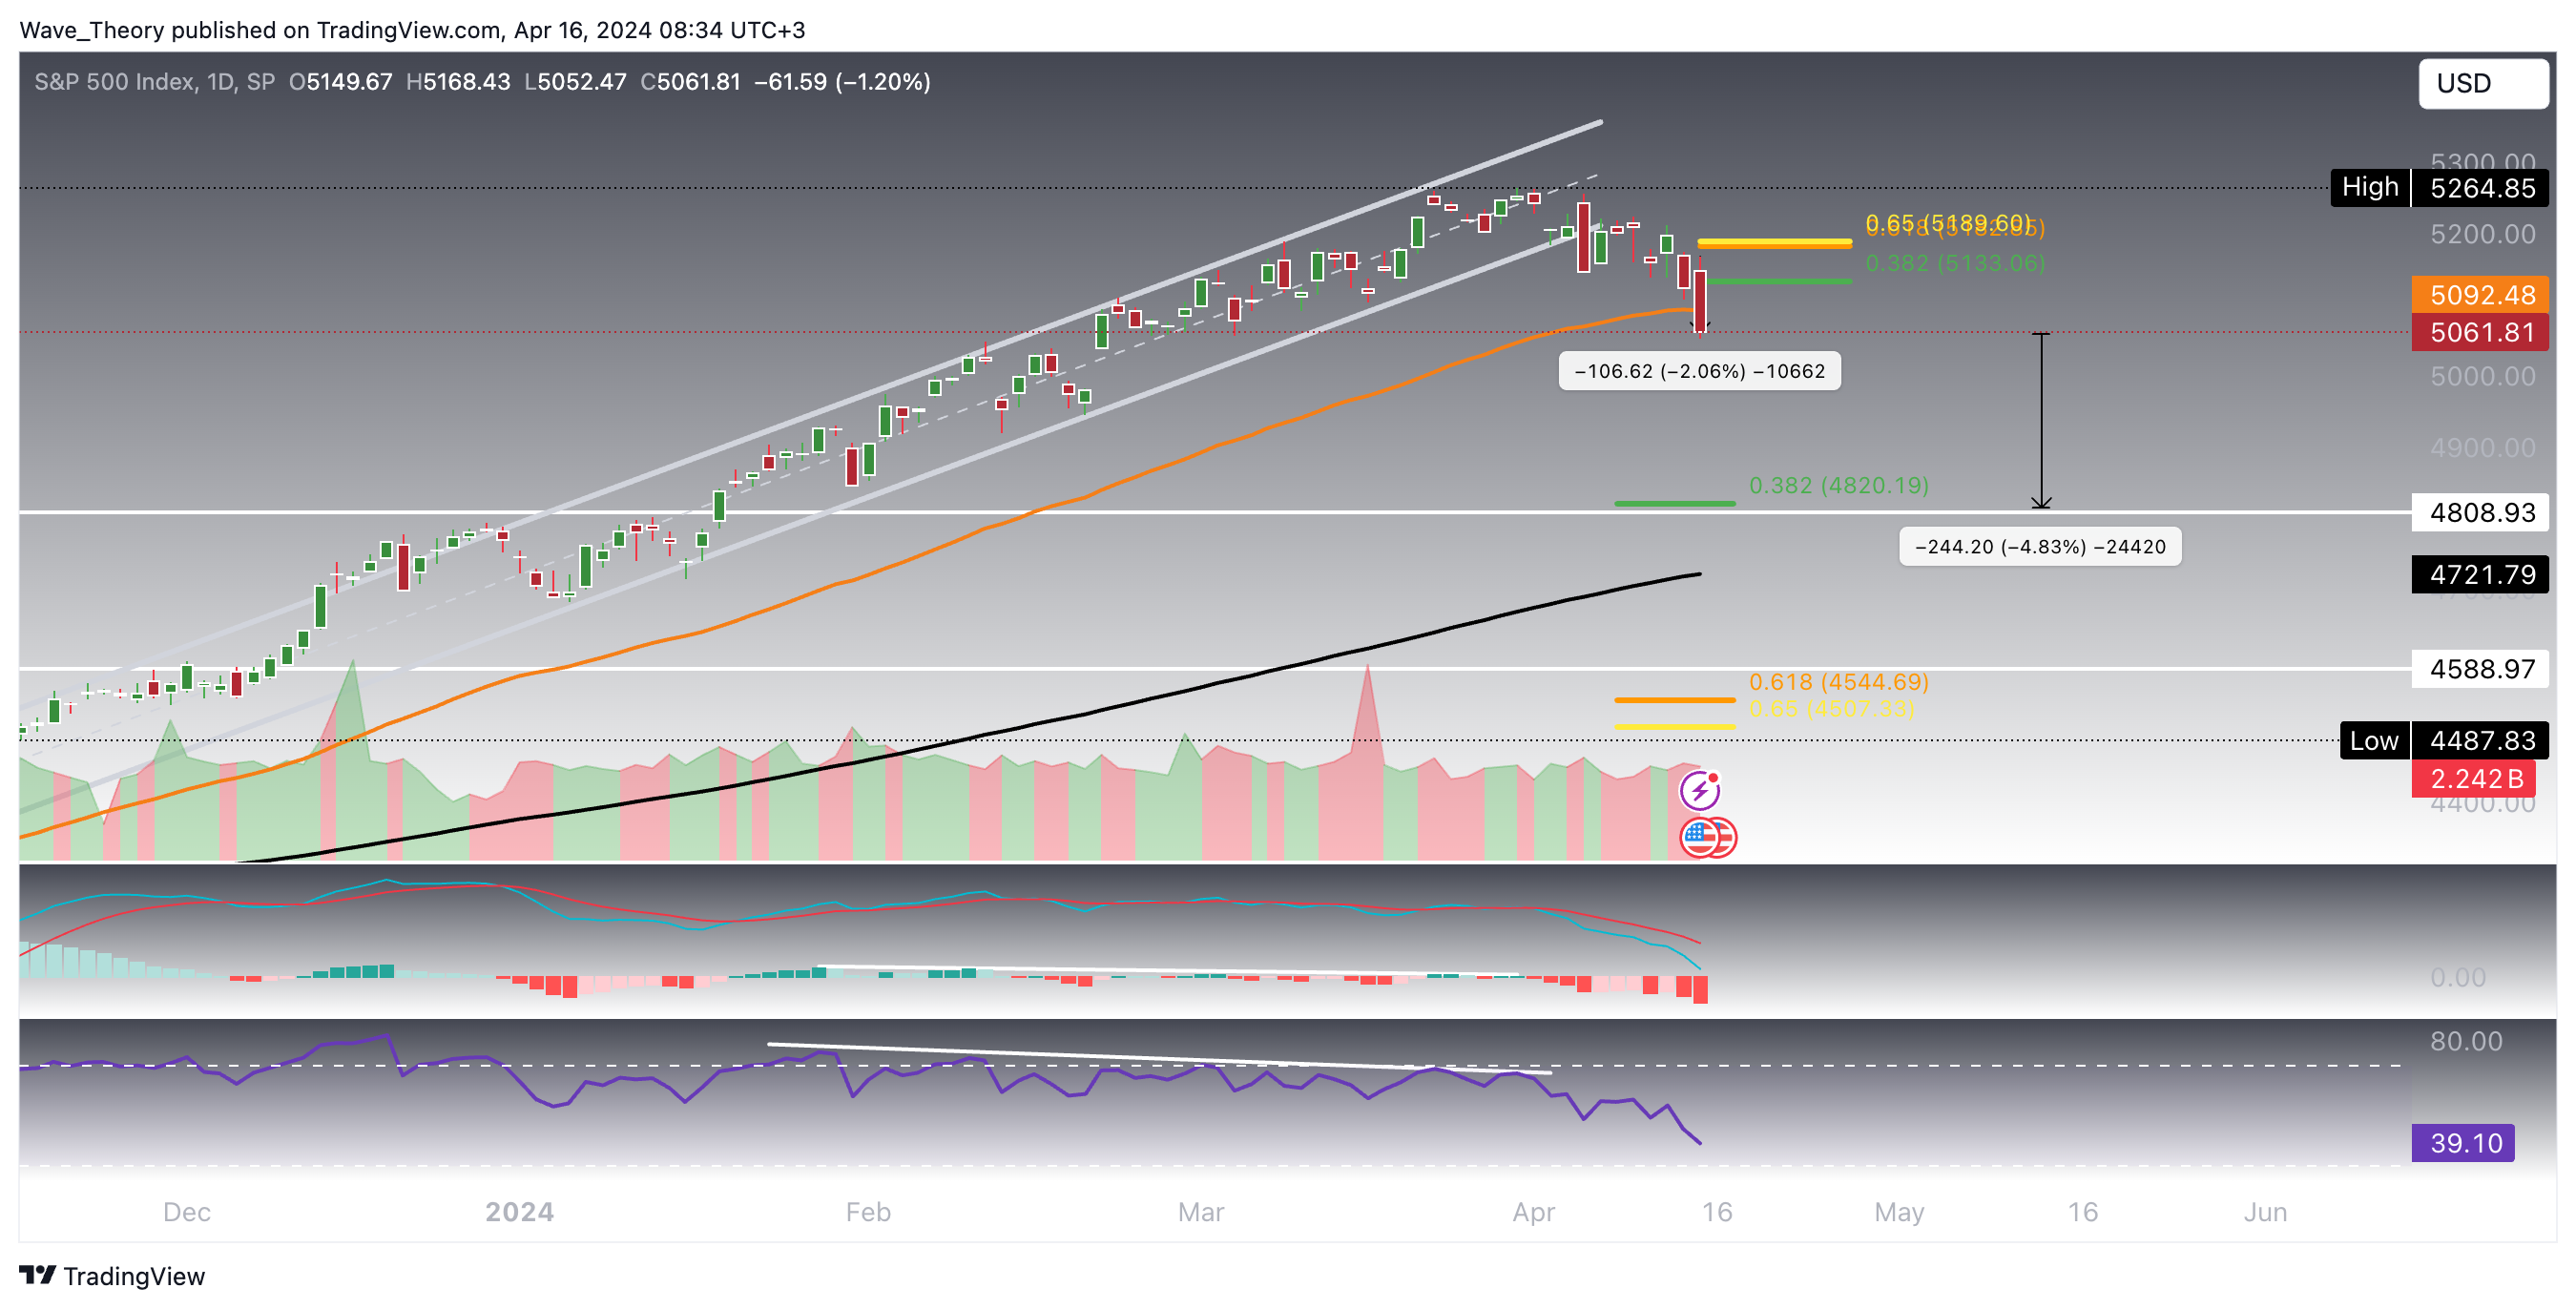
The S&P 500 (SPX) has exited its previous upward trend channel by breaking below critical support levels. Currently, it has found temporary footing at the 50-day EMA, positioned at 5,092.5.
S&P 500 (SPX): Continued Correction Anticipated
The S&P 500 (SPX) has exited its previous upward trend channel by breaking below critical support levels. Currently, it has found temporary footing at the 50-day EMA, positioned at 5,092.5. The MACD corroborates a bearish outlook, with the lines crossing downward and the histogram indicating a decrease over the past two days. Despite ambiguous signals from the RSI, the SPX appears poised to breach the 50-day EMA support downwardly. If this break occurs, we could see a descent to the next substantial Fibonacci level at 4,820, suggesting a further decline of approximately 5%.
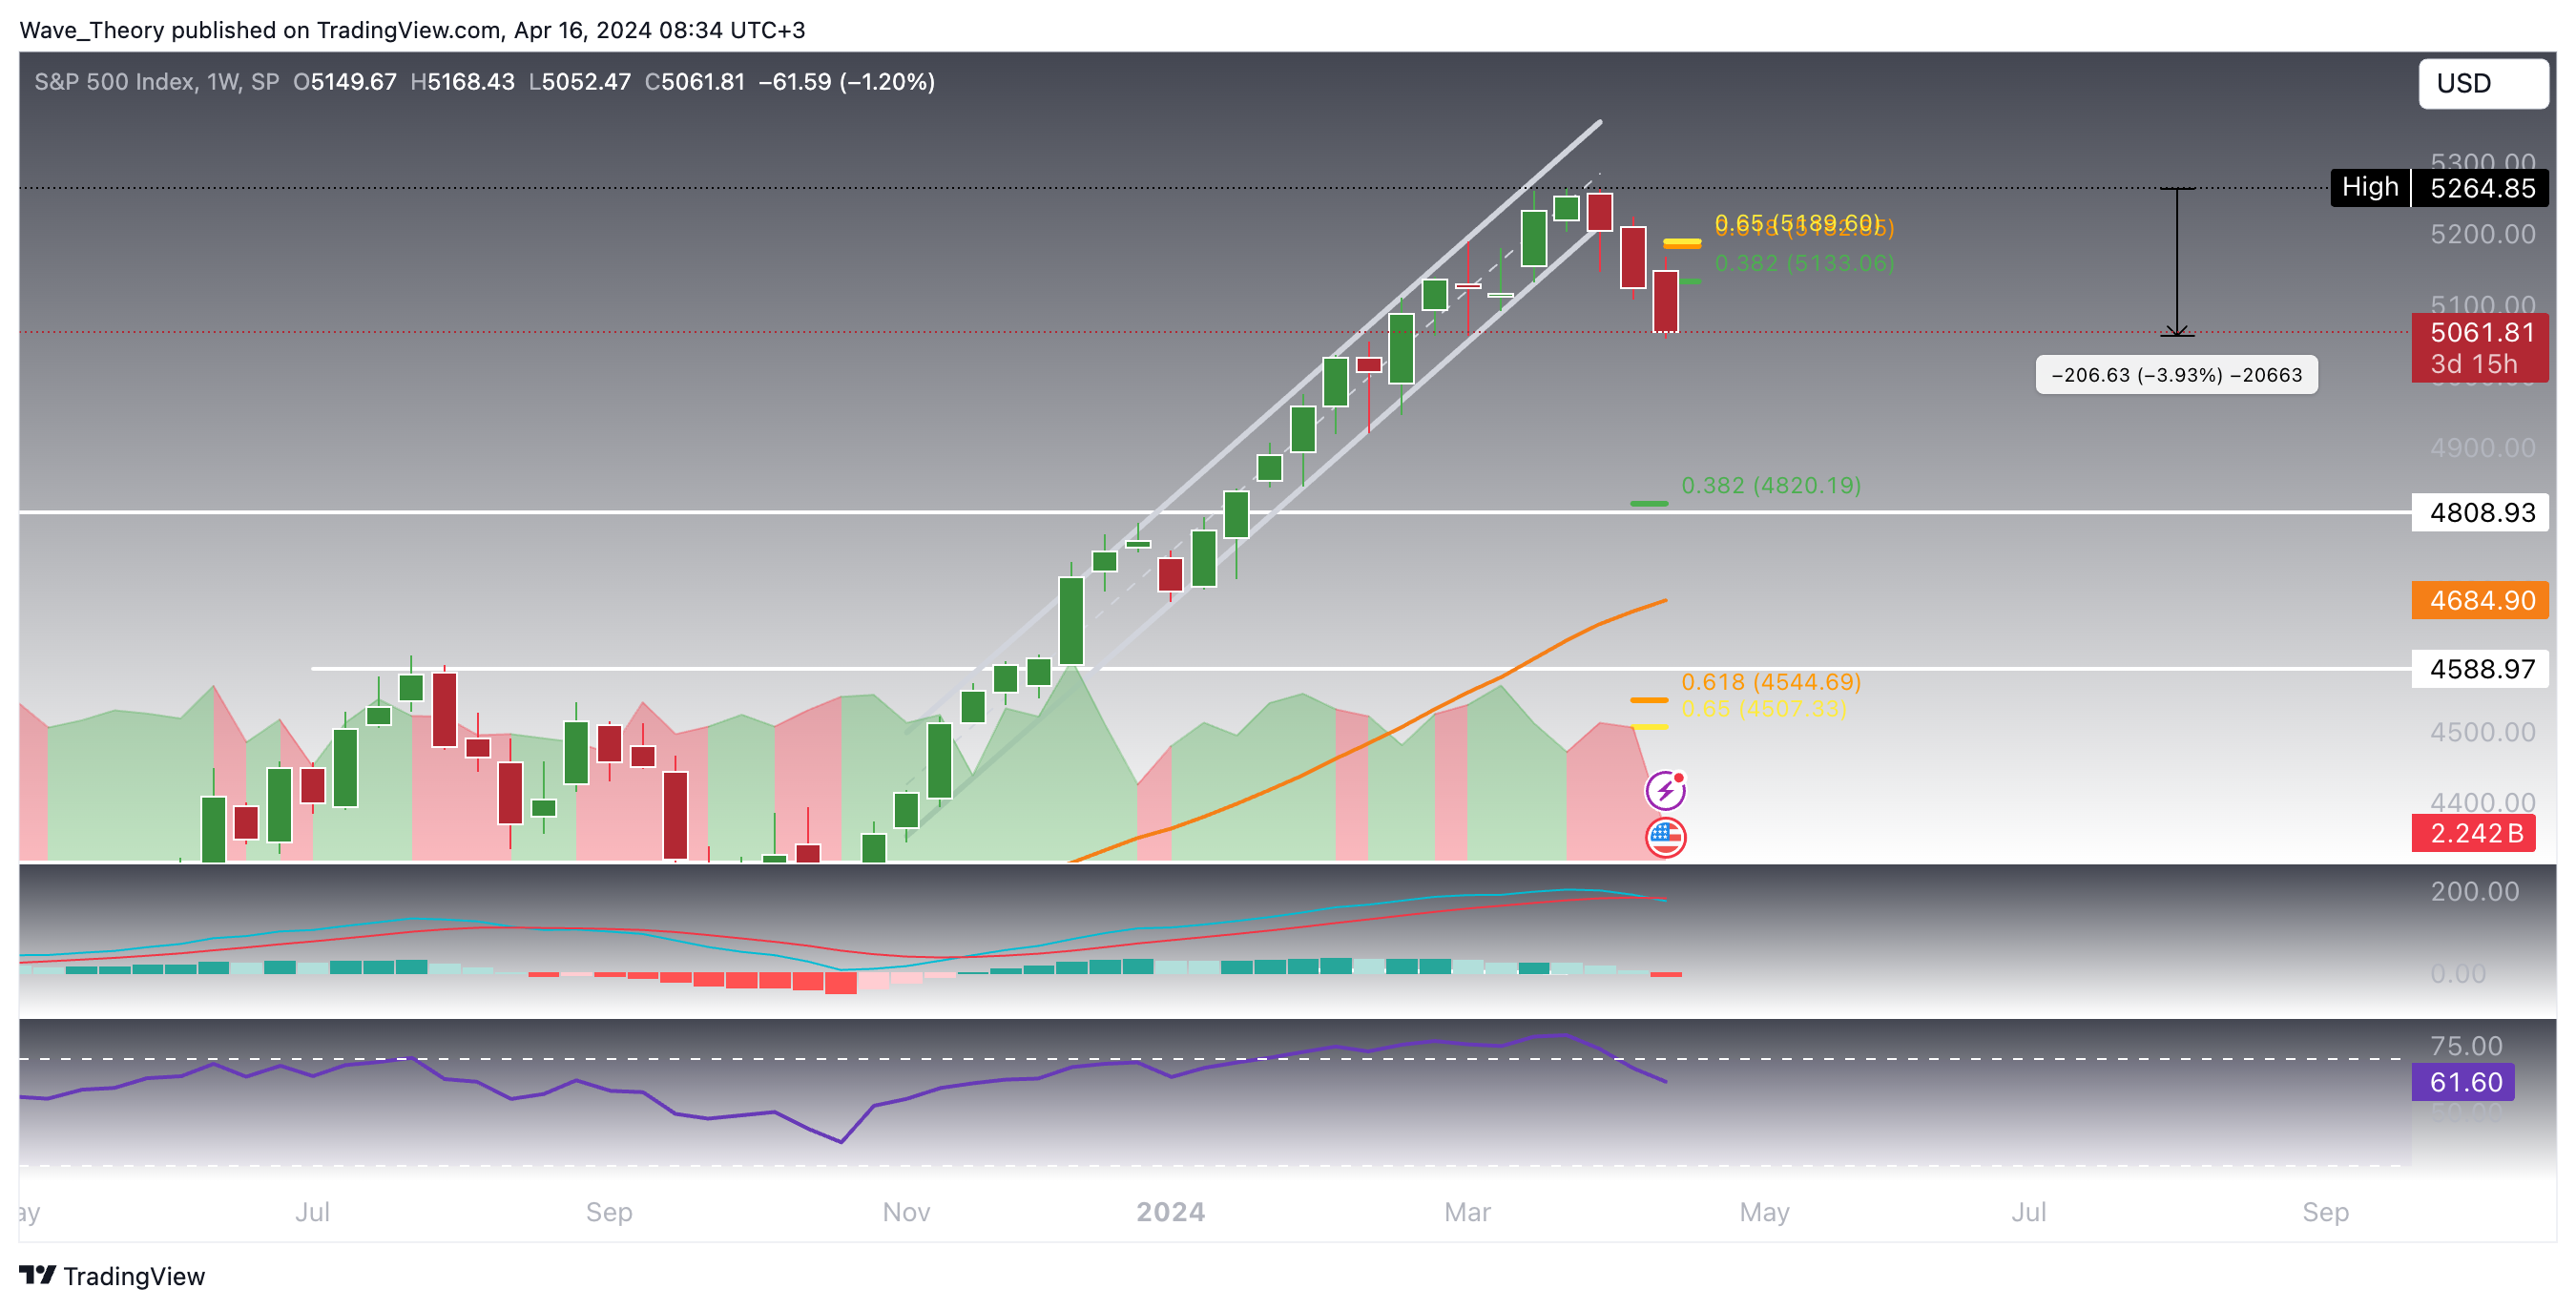
Since reaching a peak three weeks ago, the SPX has corrected by about 4%. Should a bounce occur, resistance might be encountered at Fibonacci levels 5,133 and 5,190. Nevertheless, current indicators from both daily and weekly MACD suggest the continuation of the correction.
Nasdaq Composite Index (IXIC): Potential Support Break Looming?
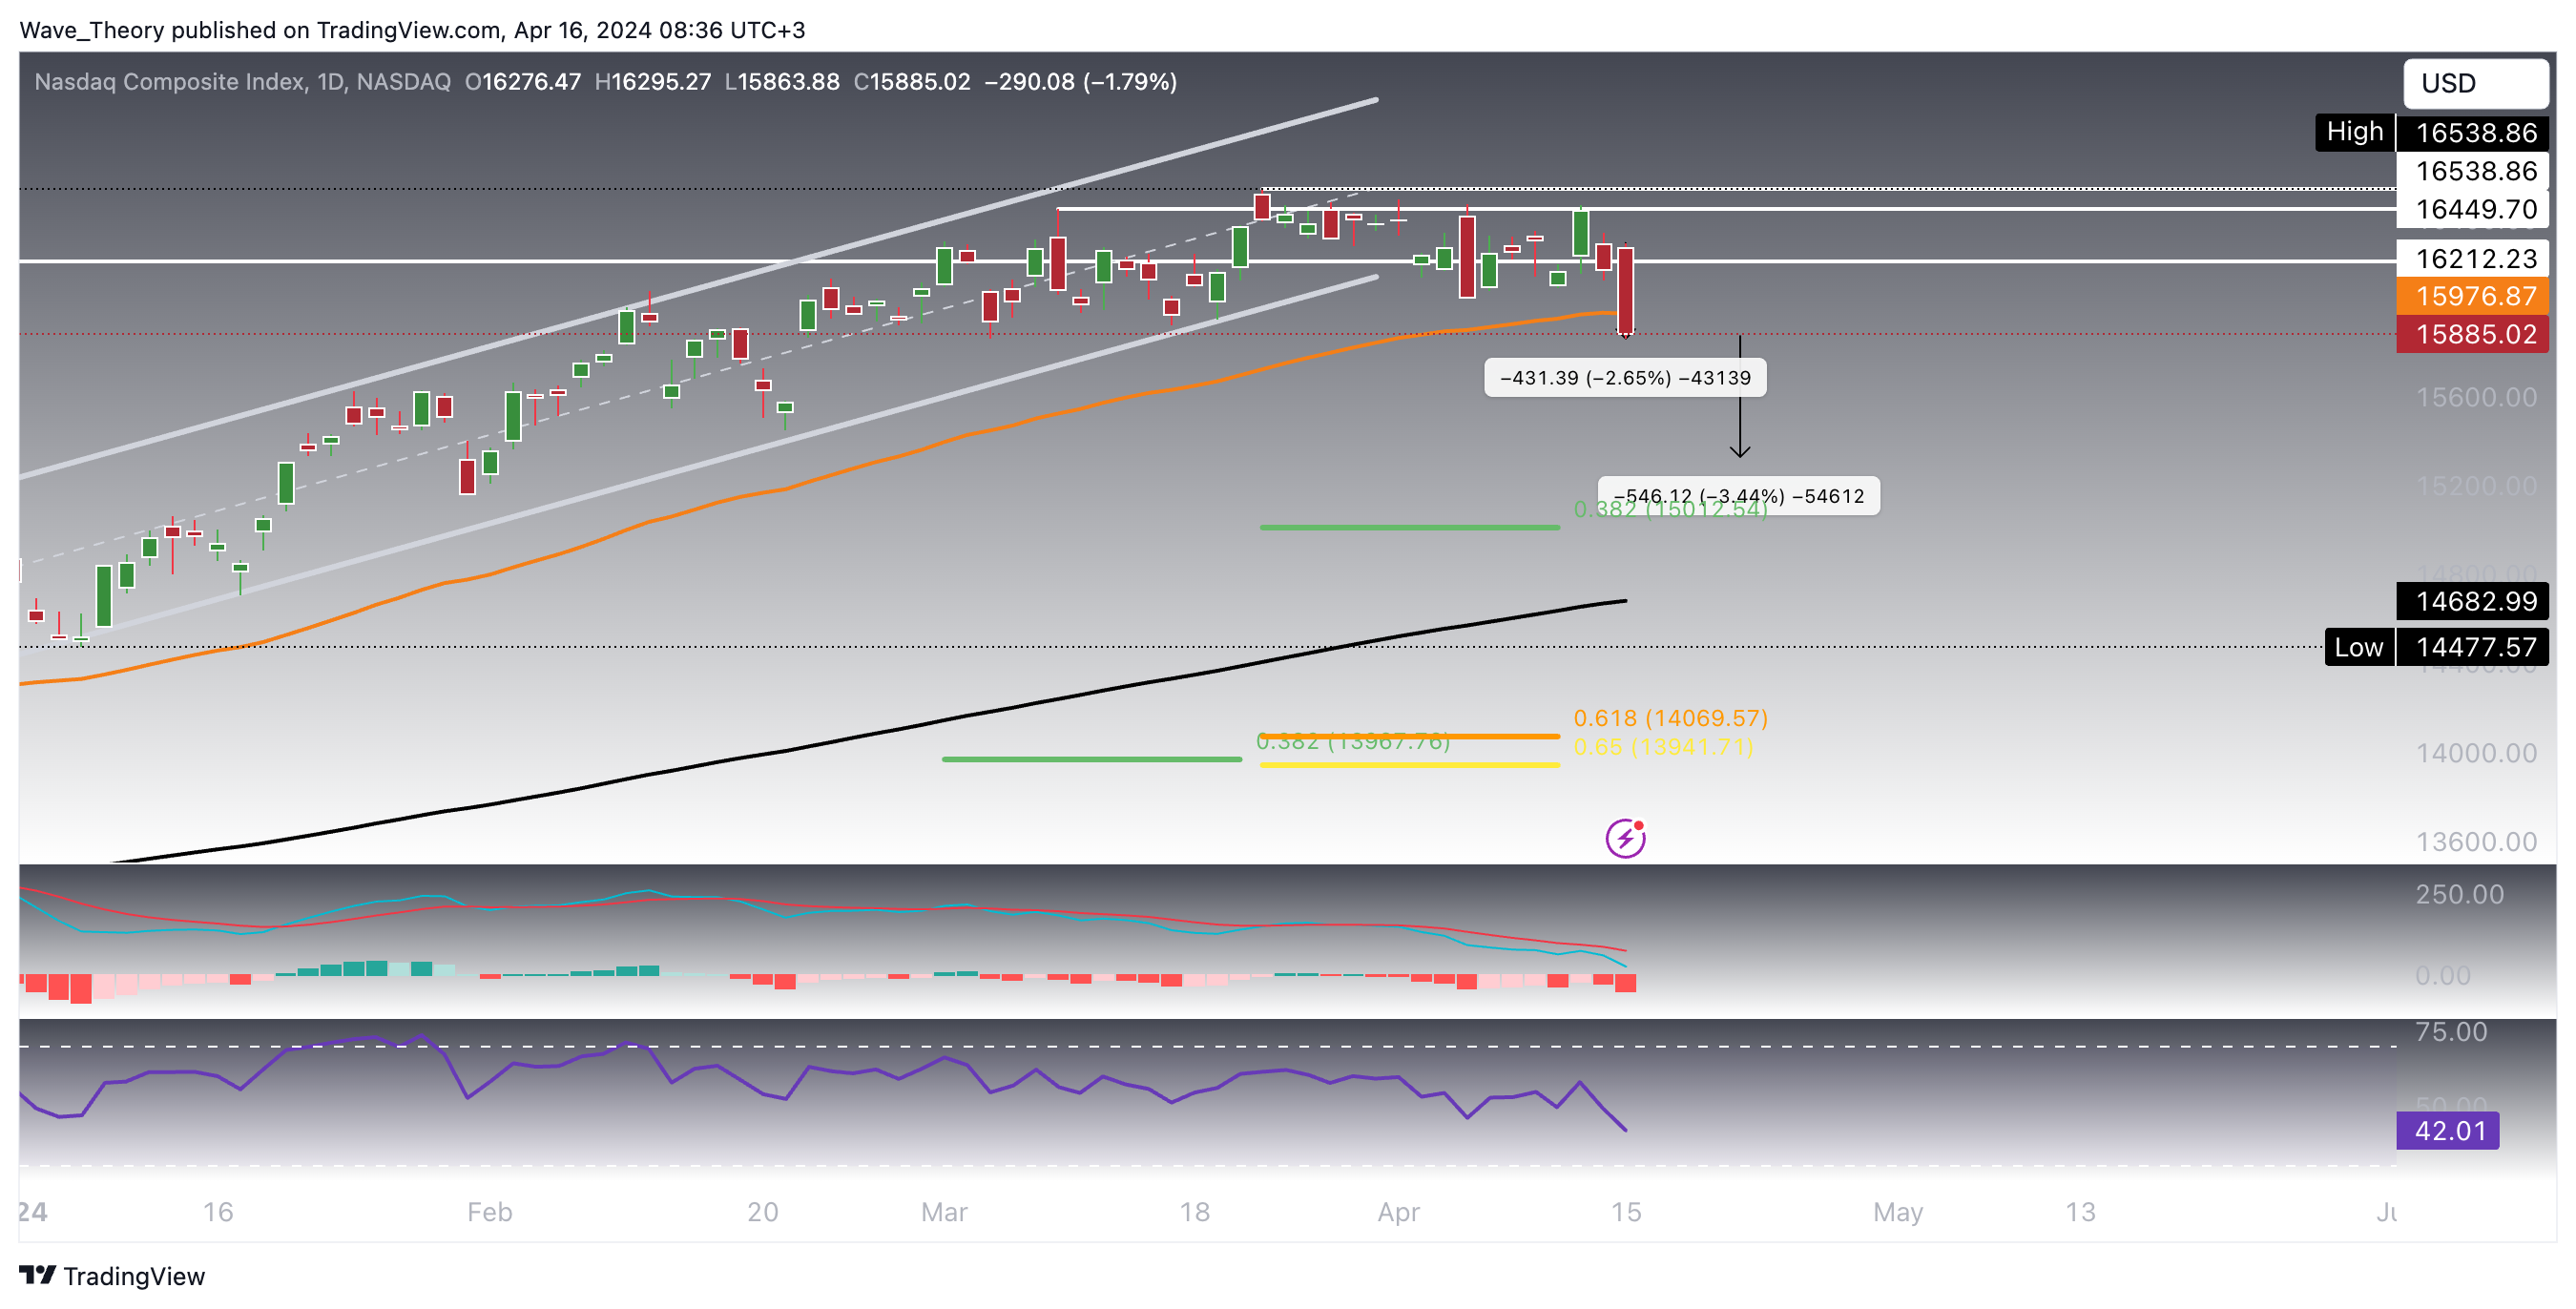
Similarly, the Nasdaq Composite (IXIC) has violated its upward channel’s support, retreating to its 50-day EMA. There is a looming possibility of breaking below this level, targeting the 0.382 Fibonacci support at 15,012.5, indicating a potential downside of roughly 5%. The bearish trend is confirmed by the MACD, with a negative crossover and declining histogram. The RSI, however, remains neutral with no definitive direction.
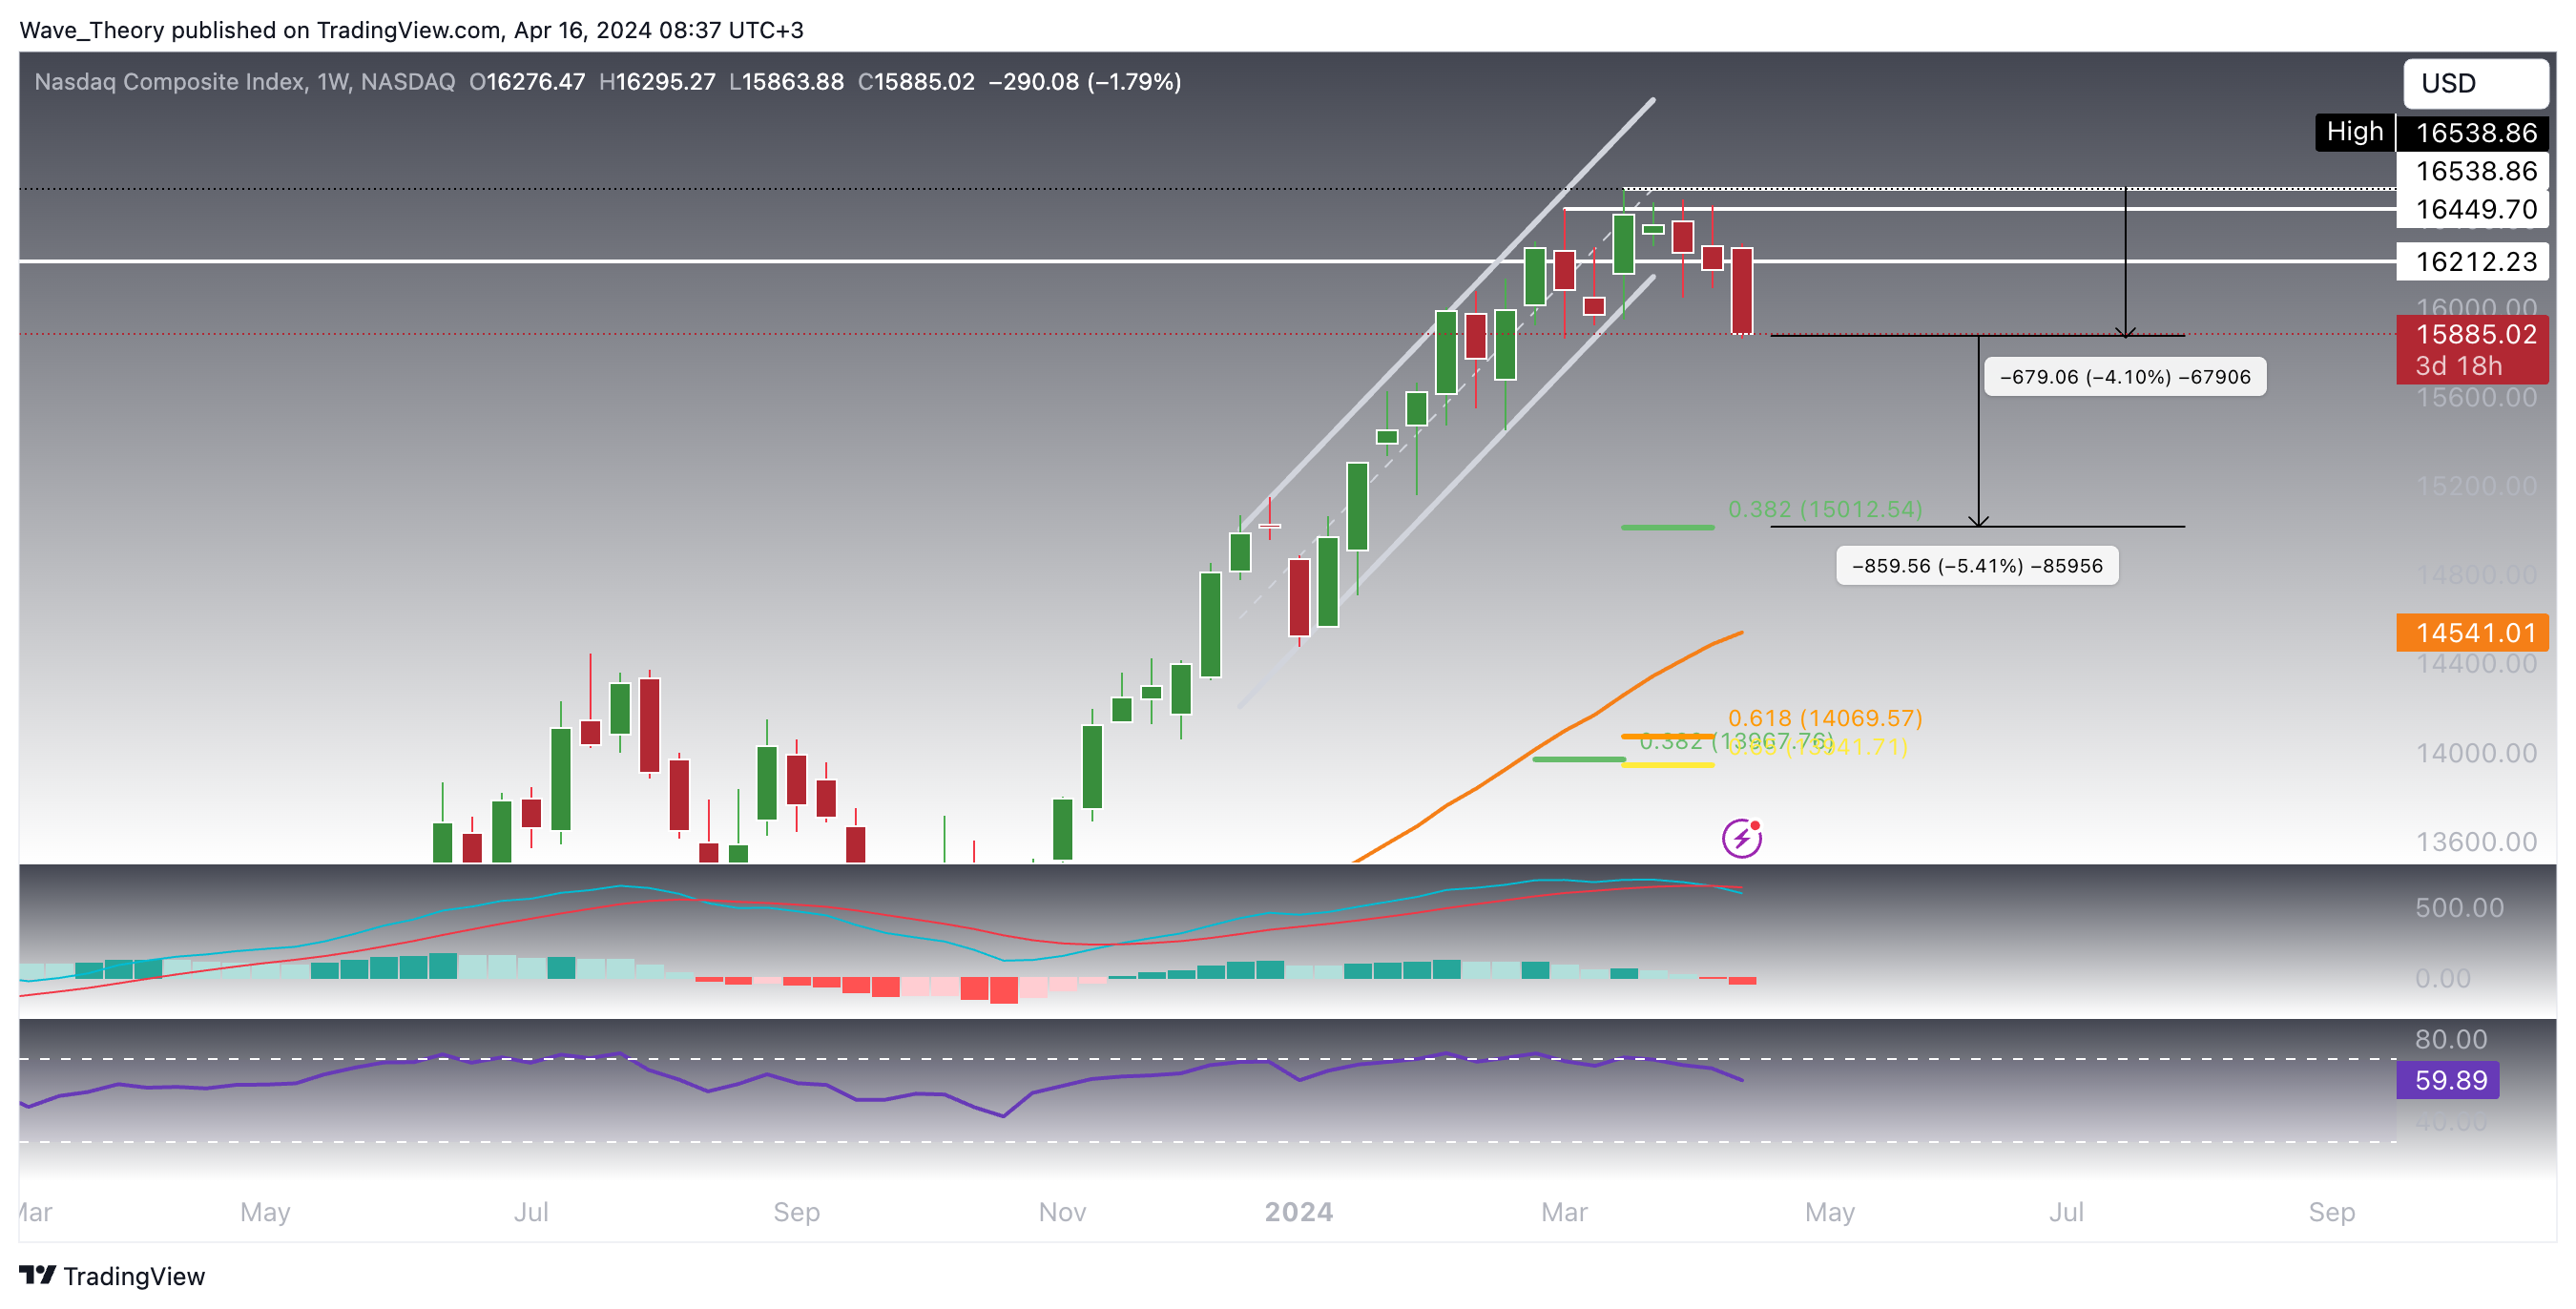
Since its recent high four weeks ago, IXIC has seen a correction of 4.1%, and the bearish sentiment is further supported by bearish crossovers in the weekly MACD.
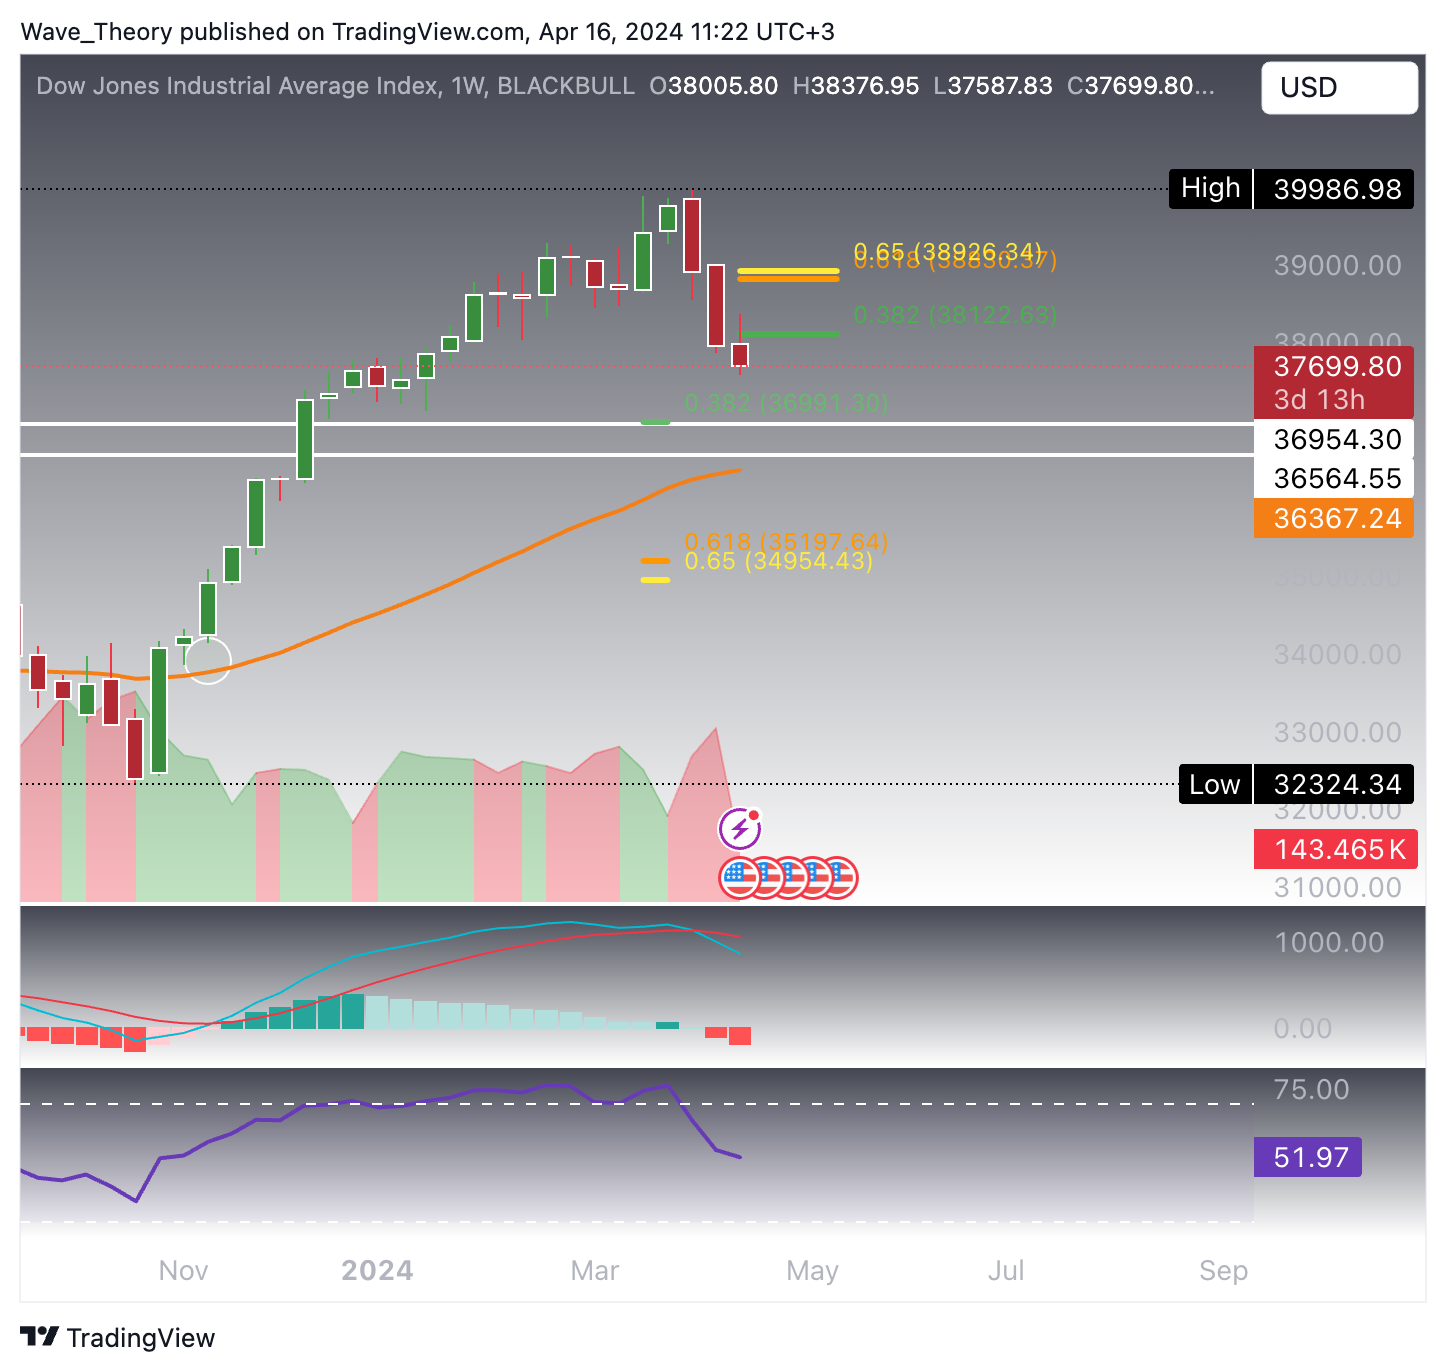
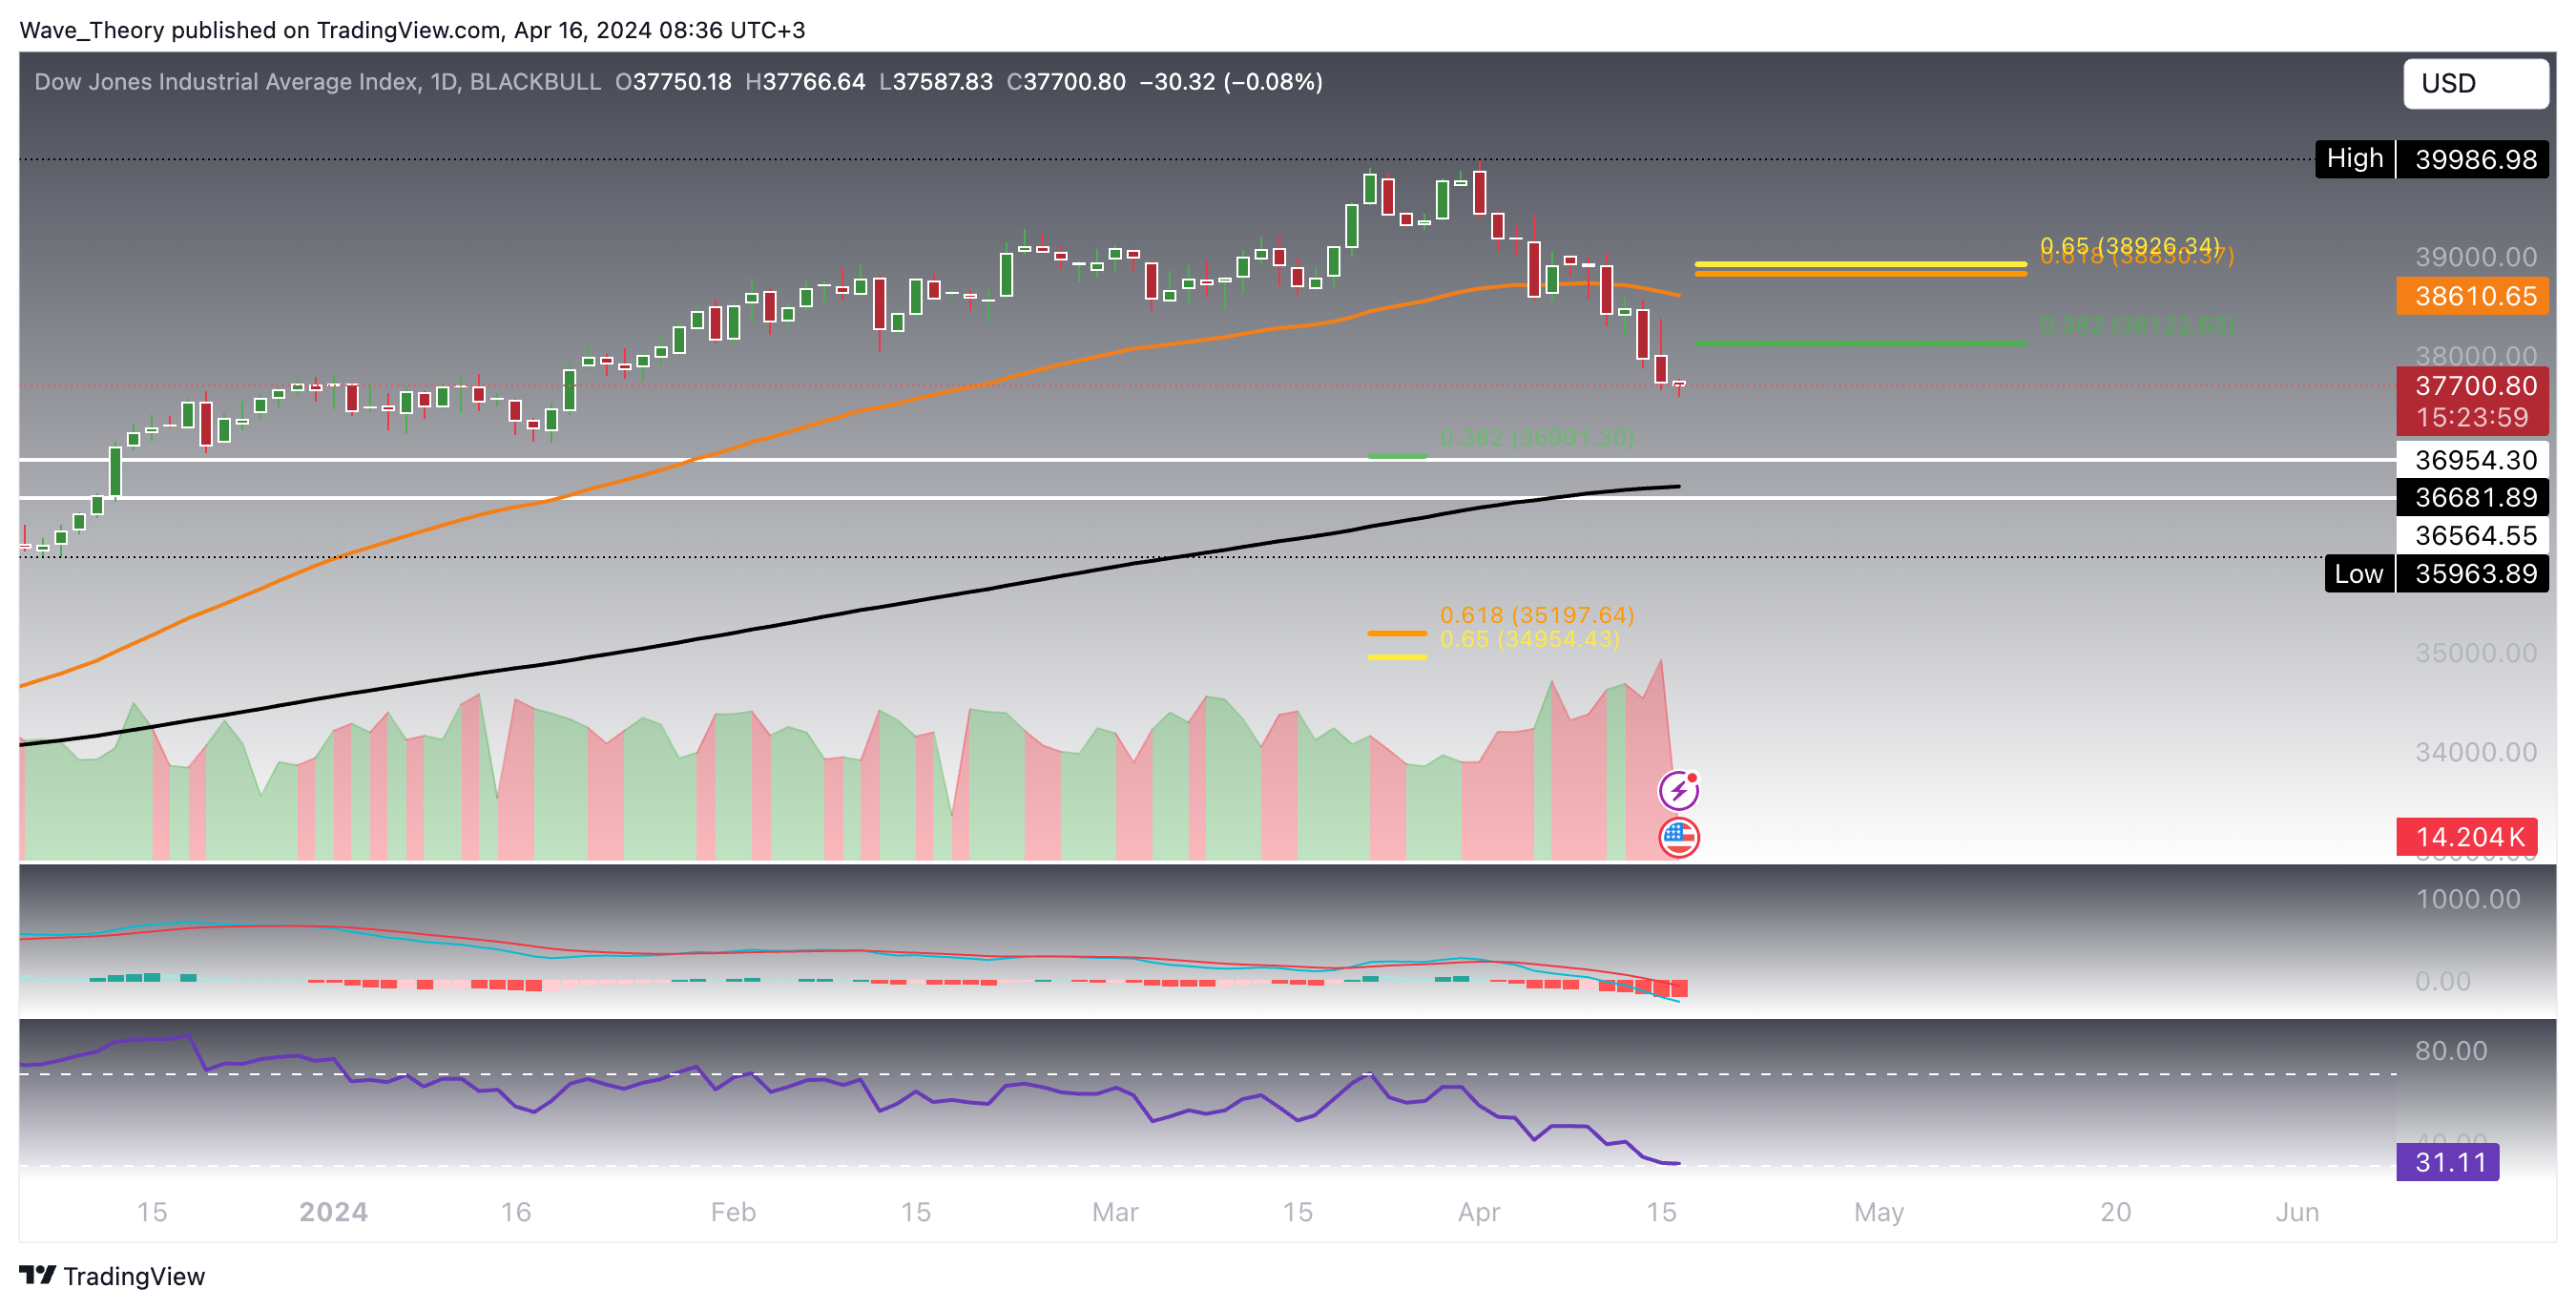
DJIA (US30): Indications of Further Decline
- Check out our free forex signals
- Follow the top economic events on FX Leaders economic calendar
- Trade better, discover more Forex Trading Strategies
- Open a FREE Trading Account
- Read our latest reviews on: Avatrade, Exness, HFM and XM
Related Articles

Sidebar rates
Related Posts
