Core (CORE/USD) Price Prediction: Surges to $2.57, Market Cap Hits $2.27 Billion Amid Rally
The Core (CORE/USD) cryptocurrency has experienced a significant surge in its market value, currently priced at $2.57, reflecting
The Core (CORE/USD) cryptocurrency has experienced a significant surge in its market value, currently priced at $2.57, reflecting a remarkable 23.79% increase over the last 24 hours. With a trading volume reaching approximately $219.97 million, Core’s performance today highlights its growing appeal among traders.
The digital asset now holds the 47th spot in the CoinMarketCap rankings, boasting a market capitalization of over $2.27 billion, supported by a circulating supply of 882.3 million CORE coins out of a maximum of 2.1 billion.
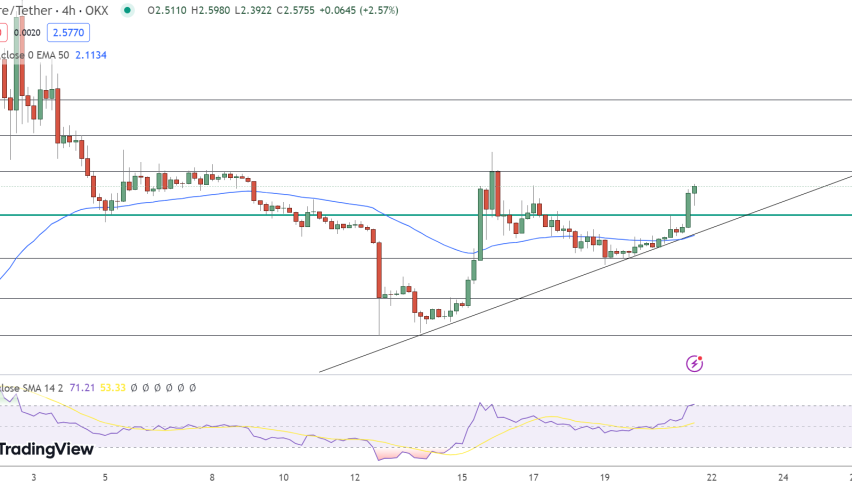
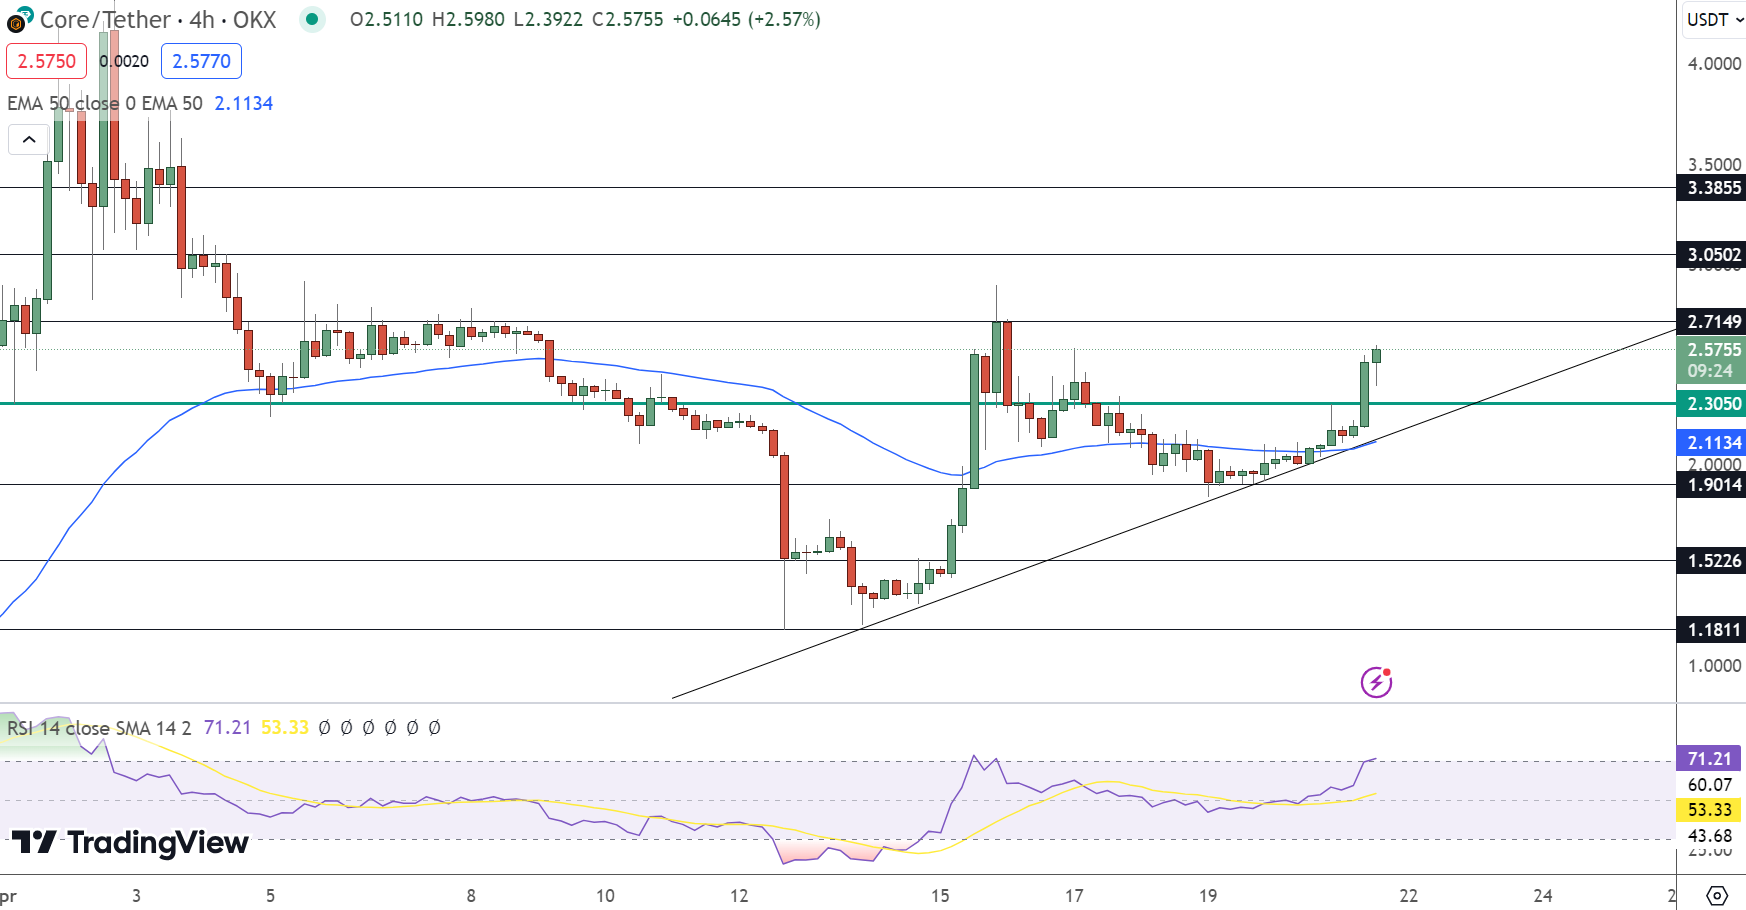
Today’s technical analysis reveals that Core is trading well above its pivot point of $2.31, suggesting a strong bullish sentiment in the market. Immediate resistance is observed at $2.71, followed by higher resistance levels at $3.05 and $3.39.
These levels represent critical junctures where selling pressures might intensify, potentially capping further advances. Conversely, support levels are established at $1.90, $1.52, and $1.18, marking thresholds where buying interest could reemerge, stabilizing price dips.
The Relative Strength Index (RSI) at 71 indicates that Core might be entering overbought territory, which could lead to a temporary pullback as traders take profits. However, the 50-day Exponential Moving Average (EMA) at $2.11 significantly below the current price, serves as a strong underlying support, reinforcing the bullish trend.
Notably, a bullish engulfing candlestick pattern on the four-hour chart suggests a potential for extending the current rally towards the $2.71 level, mirroring a triple-top pattern that could set the stage for either a breakout or a significant resistance test.
In conclusion, Core’s market dynamics are bullish above the $2.31 pivot point. However, traders should remain cautious of a possible reversal if the price fails to sustain its upward momentum or if it breaches critical support levels.
The interplay between bullish technical setups and psychological resistance points will dictate the next phases of Core’s price trajectory.
- Check out our free forex signals
- Follow the top economic events on FX Leaders economic calendar
- Trade better, discover more Forex Trading Strategies
- Open a FREE Trading Account
- Read our latest reviews on: Avatrade, Exness, HFM and XM
Related Articles

Sidebar rates
Related Posts
