Gold Price Forecast: XAU/USD Hits $2,313 Amid US Dollar Surge, Geopolitical Calm
As observed, the gold price (XAU/USD) experienced a downtrend, with prices lingering around the $2,313.91 mark, dipping to a daily low of $2,312.53.
As observed, the gold price (XAU/USD) experienced a downtrend, with prices lingering around the $2,313.91 mark, dipping to a daily low of $2,312.53.
This movement reflects the robust performance of the US dollar, which surged despite the disappointing Purchasing Managers’ Index (PMI) data from the US, indicating a slowing economic expansion in the early second quarter.
April’s S&P Global Composite PMI fell to 50.9, a subtle hint at a decelerating pace in private sector activity, compounded by an unexpected contraction in the manufacturing sector.
These dynamics suggest a sustained high-interest rate environment by the Federal Reserve, dampening the attractiveness of non-yielding assets like gold.
Easing Geopolitical Tensions Reduce Safe-Haven Demand
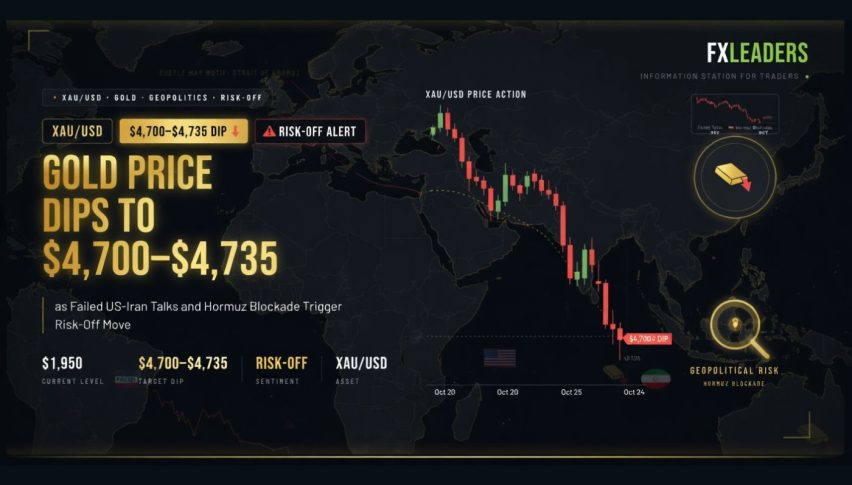
The reduction in geopolitical tensions, particularly between Israel and Iran, has positively influenced global market sentiment, further diminishing the demand for gold as a haven.
Despite ongoing regional conflicts, signals of de-escalation have emerged, reducing the likelihood of broader military engagements and, subsequently, the urgency for safe-haven assets.
Technical Analysis: Key Levels and Indicators for Gold
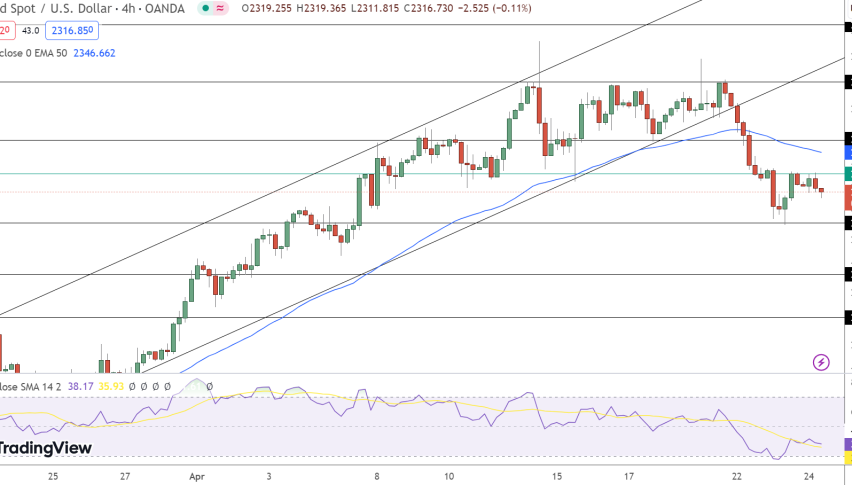
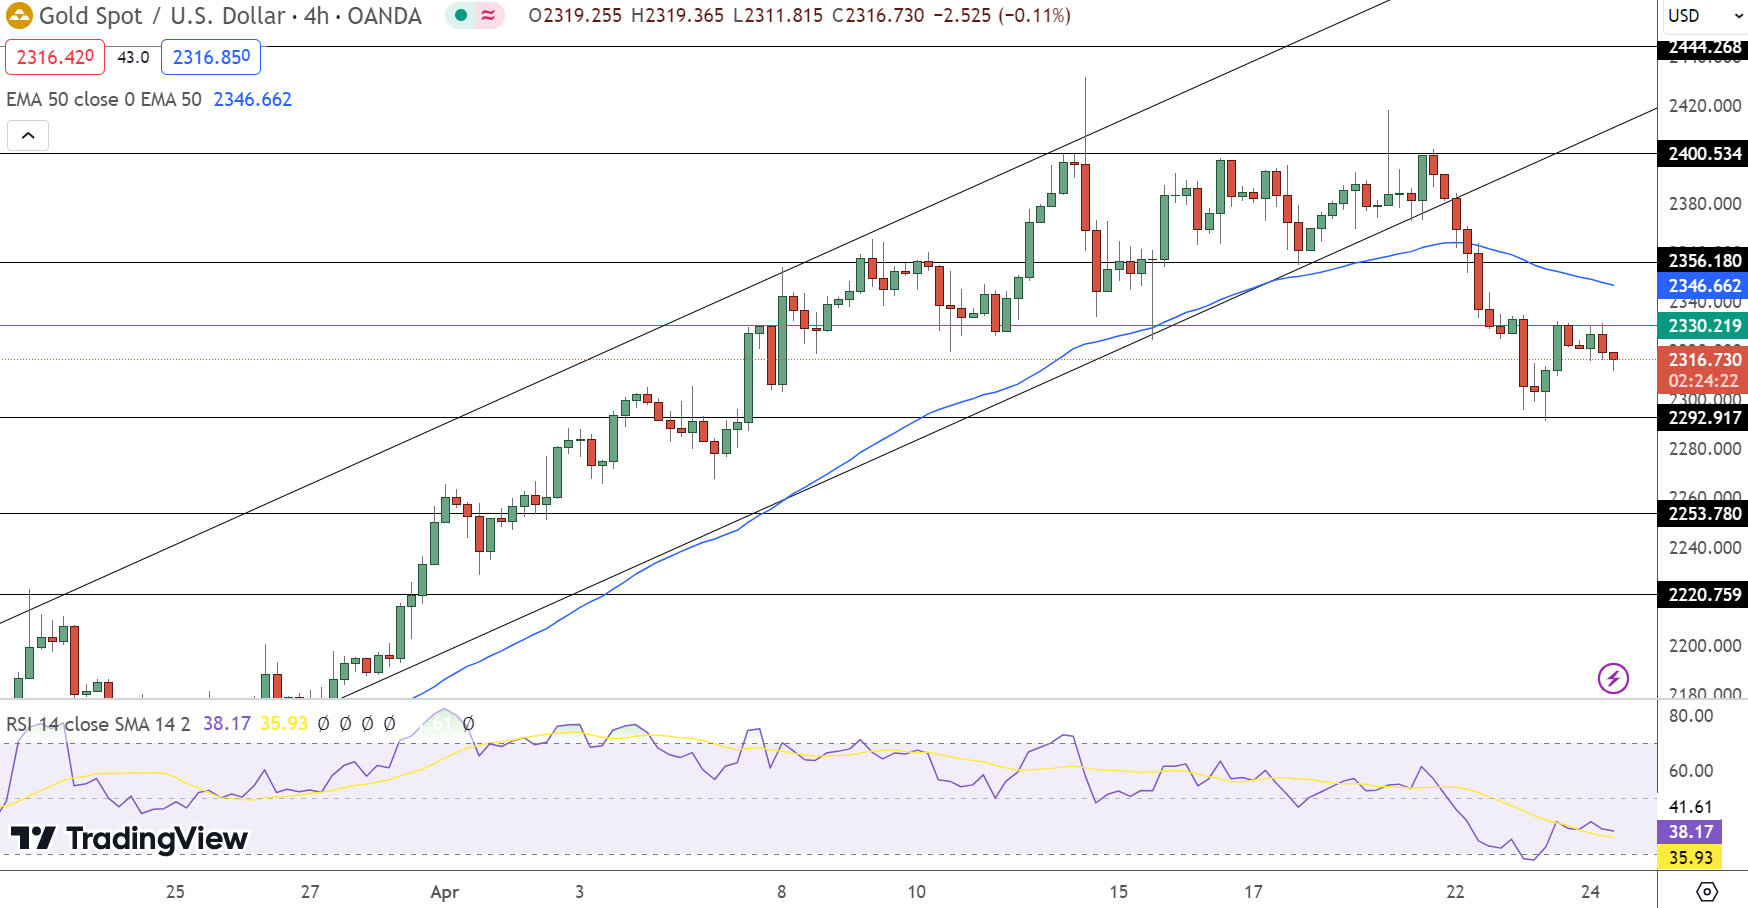
Turning to the technical landscape, the immediate outlook for gold prices shows a slight recovery, with a 0.20% increase to $2,324.95, positioning just above the critical support level of $2,317.10.
Resistance points are mapped at $2,346.21 and $2,359.26, with a more formidable barrier at $2,382.85, which could signal a bullish reversal if surpassed. Conversely, support levels are set at $2,290.91 and $2,268.20, providing potential buying opportunities should prices dip to these points.
The Relative Strength Index (RSI) at 40 points to a balanced market state, neither overbought nor oversold, hinting at potential shifts without significant buying or selling pressure.
Meanwhile, the 50-day Exponential Moving Average (EMA) at $2,364.13 underscores a recent downtrend, yet offers a potential pivot for upward movement as prices near this average.
Notably, gold has surpassed the 23.6% Fibonacci retracement, eyeing the 38.2% level at approximately $2,333, which could encourage further gains if sustained.
Investors might consider a strategic approach with a buy limit order at the pivot point of $2,317, aiming for a take profit near the immediate resistance of $2,346, and a stop loss positioned at $2,296 to safeguard against potential declines.
This strategy capitalizes on the current market dynamics, aligning with both fundamental influences and technical indicators to optimize potential returns in the XAU/USD market.
- Check out our free forex signals
- Follow the top economic events on FX Leaders economic calendar
- Trade better, discover more Forex Trading Strategies
- Open a FREE Trading Account
- Read our latest reviews on: Avatrade, Exness, HFM and XM
Related Articles

Sidebar rates
Related Posts
