Market Recovery: S&P 500 (SPX), Nasdaq Composite (IXIC), and DJIA (US30) Bounce Upwards

The SPX, IXIC and US30 behave in a similar way. After a steep correction, they are set for a bounce towards the upside.
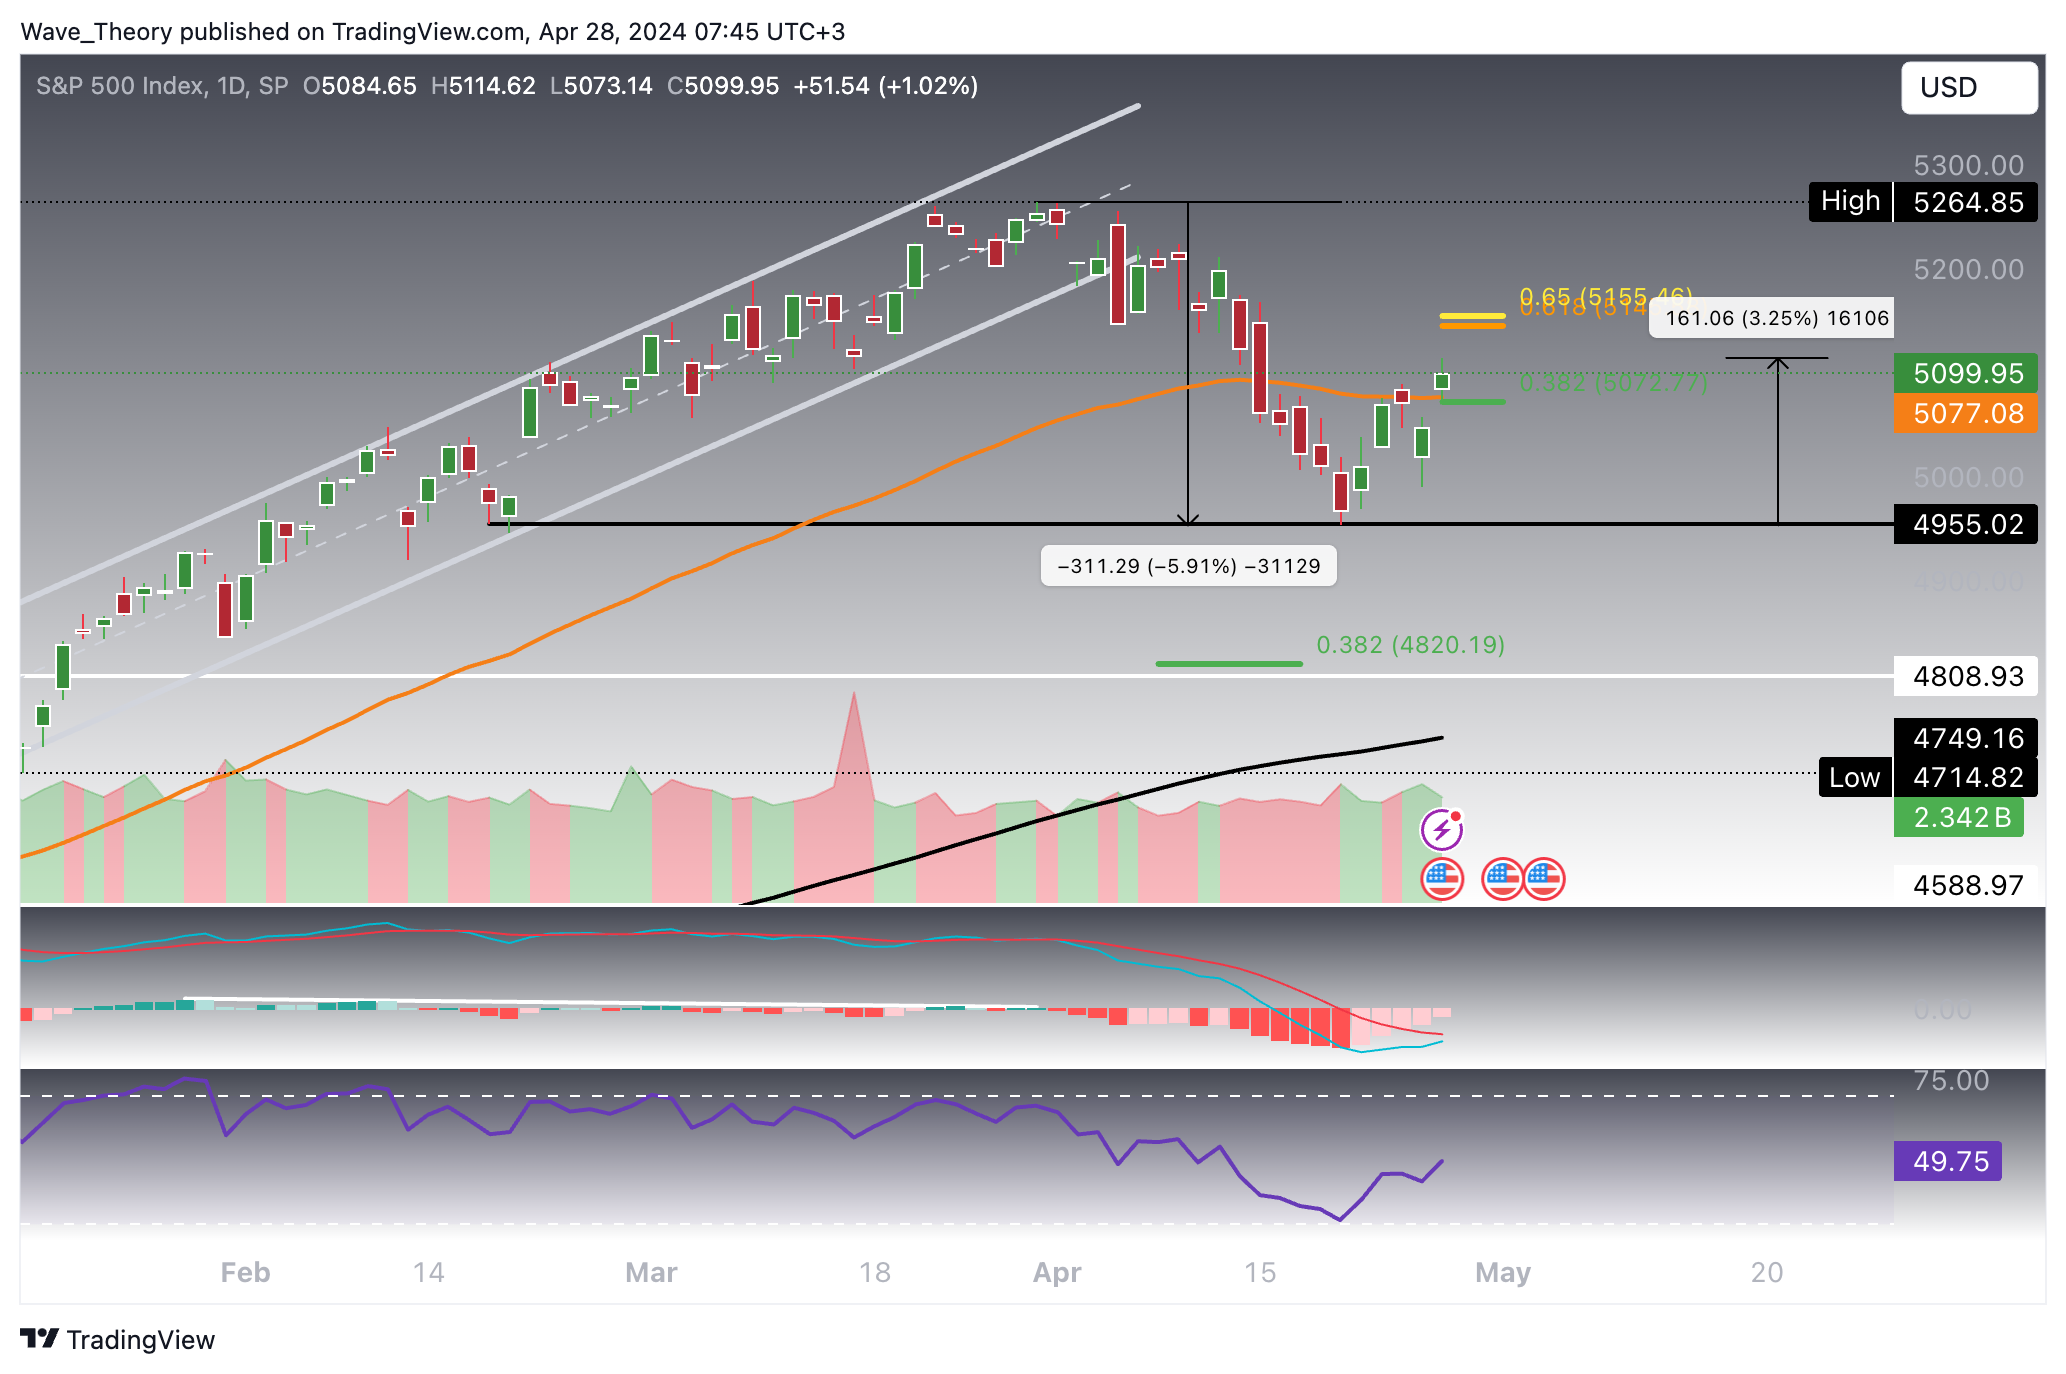
S&P 500 (SPX): Overcoming Resistance?
The S&P 500 (SPX) recently exited its ascending trend channel, breaking critical support levels, including the 50-day EMA at 5,077, before establishing a temporary low at 4,955. Since this nadir, the SPX has rebounded impressively by 3.25%, successfully reclaiming the 50-day EMA and surpassing the 0.382 Fibonacci level between 5,073 and 5,077.
The index is now poised to test the Golden Ratio at 5,155. Should SPX decisively breach this resistance, it may reestablish its bullish trajectory, rendering the recent correction moot. Conversely, a failure at this juncture could see SPX retreating to a significant support at 4,955, and potentially further to the 0.382 Fib level at 4,820. The RSI on the daily chart remains ambiguous, yet the MACD histogram suggests a bullish trend, with an impending bullish crossover of the MACD lines. The EMAs already established a Golden Crossover, confirming the trend bullishly in the short- to medium term.
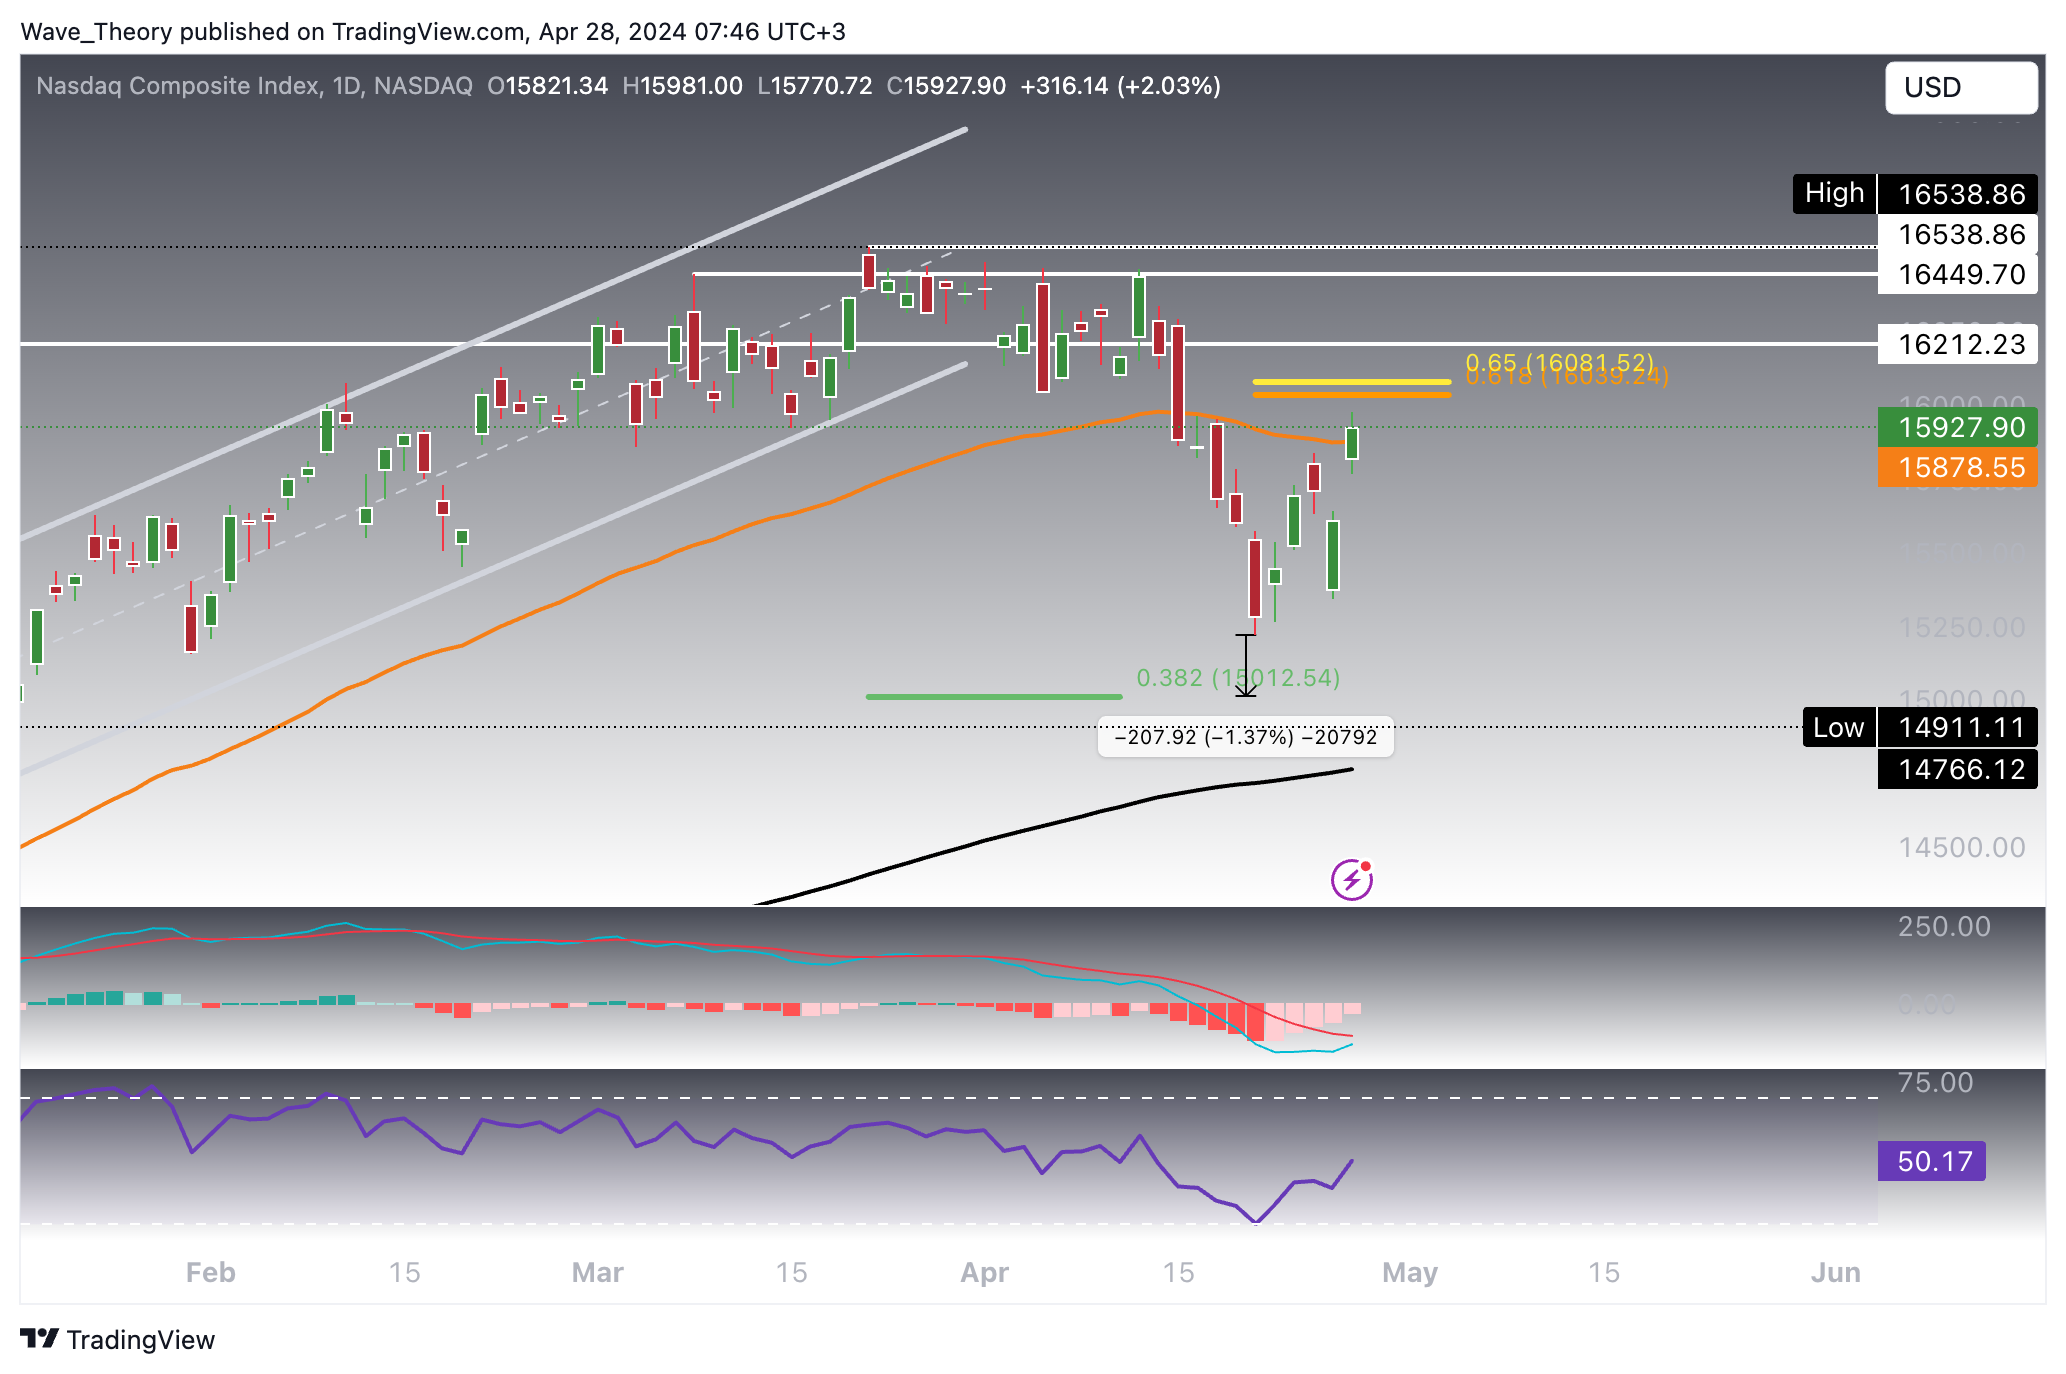
Nasdaq Composite Index (IXIC): Will IXIC Return To Its Uptrend?
Following a substantial correction falling short of its target by approximately 1.4%, the Nasdaq Composite Index (IXIC) has rallied nearly 5%. It now contends with the 50-day EMA resistance at 15,879. A bullish breach here could propel IXIC towards the critical Golden Ratio resistance at 16,081. Overcoming this Fibonacci milestone would signal a negation of the correction, potentially resuming the uptrend.
The daily chart’s indicators reinforce this bullish sentiment, with EMAs displaying a golden crossover and the MACD histogram trending upwards, hinting at an upcoming bullish MACD crossover. The RSI, however, remains neutral, offering no definitive momentum cues.
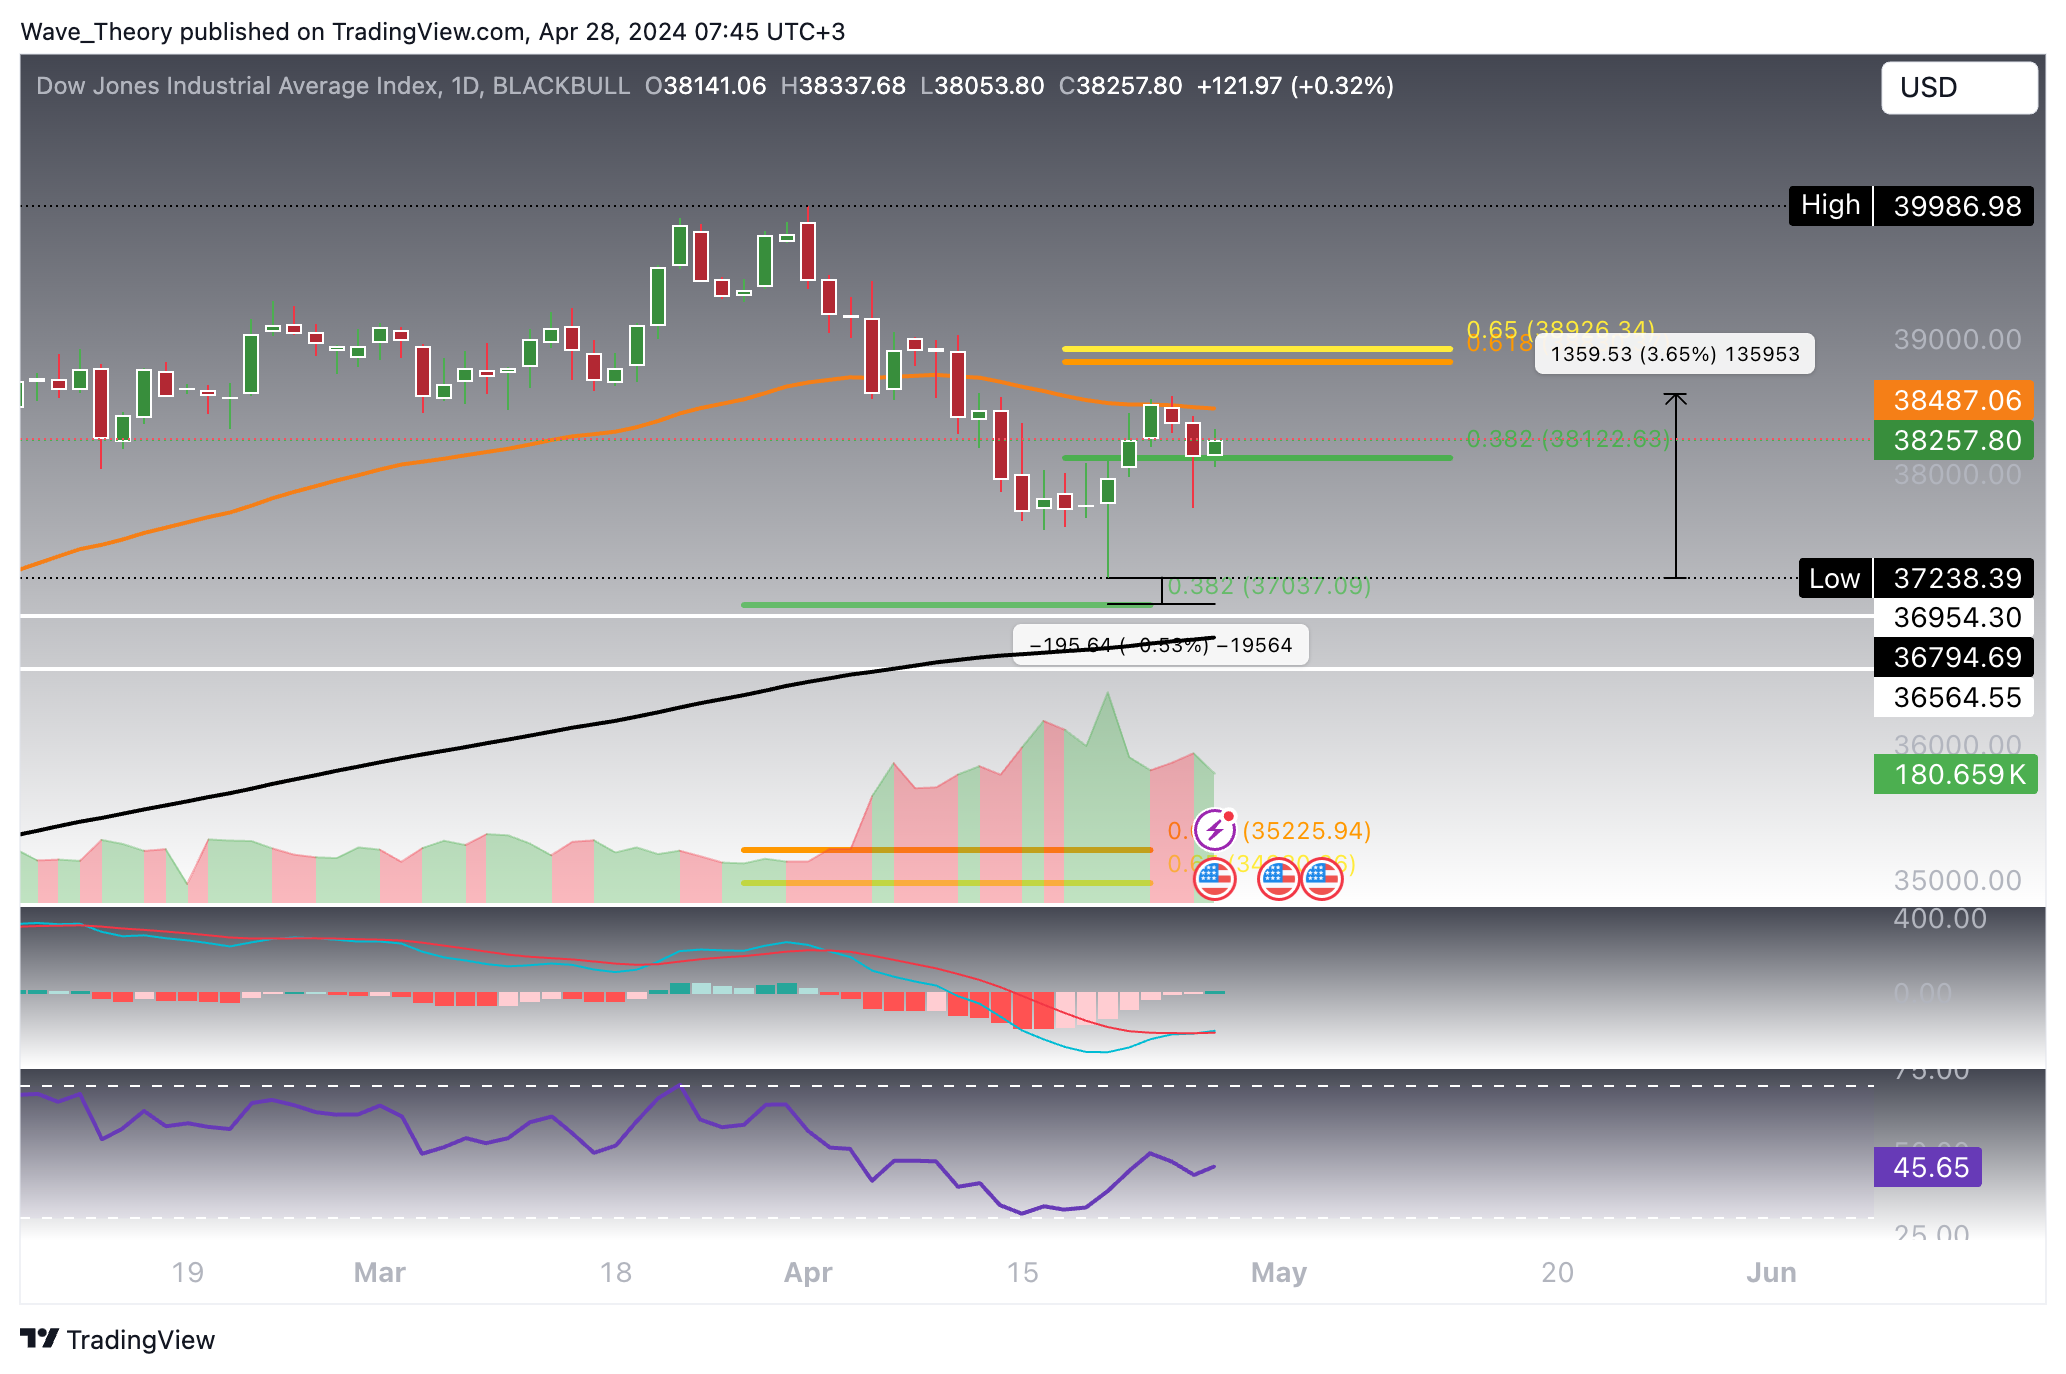
DJIA (US30): US30 Missed The Correction Target By 0.5 %
The DJIA (US30) experienced a significant correction, descending to 37,238.4, narrowly missing the 0.382 Fib support at 37,037. Since bottoming out, US30 has rallied by 3.65%, but currently faces resistance at the 50-day EMA of 38,487, where it has so far been rejected.
Should it overcome this barrier, the index could ascend to the Golden Ratio at 39,926. A bullish breakthrough at this level would invalidate the correction phase, reaffirming US30’s uptrend. The daily chart indicators are predominantly bullish, with a golden crossover in the EMAs and the MACD lines on the verge of a bullish crossover, complemented by a rising MACD histogram. The RSI, however, continues to oscillate within neutral territory.
- Check out our free forex signals
- Follow the top economic events on FX Leaders economic calendar
- Trade better, discover more Forex Trading Strategies
- Open a FREE Trading Account
- Read our latest reviews on: Avatrade, Exness, HFM and XM
Related Articles


Sidebar rates
Related Posts
