GBP/USD Climbs to 1.2549 as Markets Anticipate FOMC Decision and BoE Rate Cuts
During the European trading session, the GBP/USD pair exhibited a strong upward movement, consistently trading around 1.2538 and peaking at an intraday high of 1.2549.

During the European trading session, the GBP/USD pair exhibited a strong upward movement, consistently trading around 1.2538 and peaking at an intraday high of 1.2549.

This rise is primarily attributed to the weakening US Dollar, which has struggled to gain momentum amidst a risk-on market environment. The currency market is now keenly focused on the upcoming Federal Open Market Committee (FOMC) interest rate decision and press conference scheduled for Wednesday.
US Dollar’s Retreat Amid Fed’s Hawkish Outlook:
Despite a generally hawkish stance from the Federal Reserve regarding interest rates, the US dollar continues to face downward pressure, driven by positive market sentiment and expectations that the Fed will maintain rates between 5.25% and 5.5%.
With the US economy showing robustness, yet grappling with rising inflation, rate cut expectations have been postponed, potentially until September.
This scenario was reinforced by recent data from the US Bureau of Economic Analysis, which reported a rise in the Core PCE Price Index, underscoring persistent inflationary pressures.
BoE Rate Cut Speculations and GBP/USD Impact:
In the UK, market sentiment is increasingly leaning towards a potential interest rate cut by the Bank of England (BoE) in June. Recent comments by BoE Governor Andrew Bailey have fueled speculations of possible rate reductions later this year.
Such dovish policy adjustments could potentially weaken the British Pound and restrain further advances in the GBP/USD exchange rate.
GBP/USD Price Forecast: Technical Perspective:
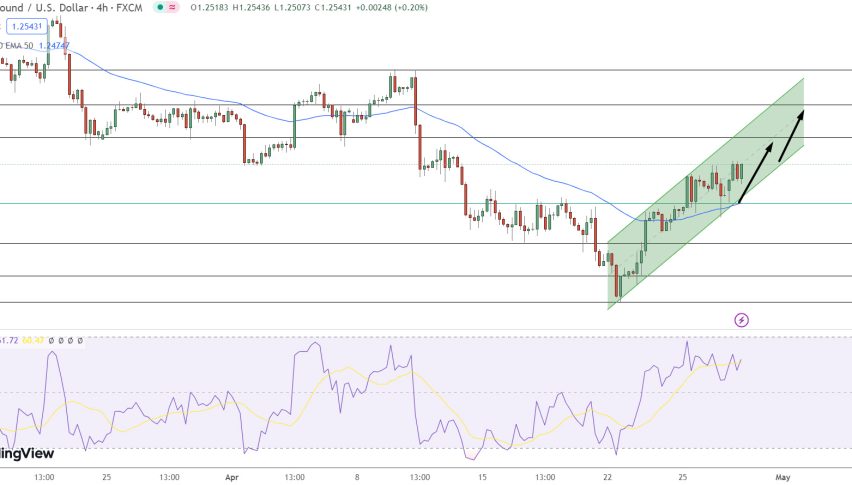
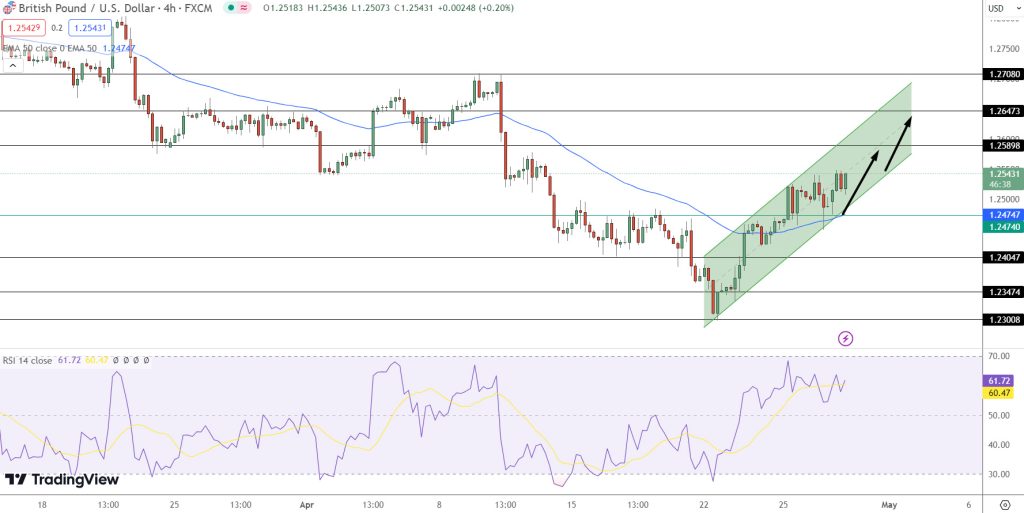
Currently, the GBP/USD pair has risen by 0.43%, reaching 1.25423. The currency pair is navigating above a pivotal technical point set at 1.25151 on the 4-hour chart. A sustained position above this pivot could propel GBP/USD towards an initial resistance at 1.25795.
With continued upward momentum, the next resistance levels at 1.26377 and 1.27034 could be tested. Conversely, a reversal in gains might see the pair seeking support at 1.24498, with further support levels at 1.23929 and 1.23369 should the decline intensify.

The Relative Strength Index (RSI) is at 63, indicating an increasing momentum but not yet reaching overbought conditions. Additionally, the 50-Day Exponential Moving Average (EMA) at 1.2470 now provides underlying support, bolstering the upward trend as it remains below the current trading price.
This technical setup offers a bullish outlook for GBP/USD, suggesting potential for further upward movement in the near term.
- Check out our free forex signals
- Follow the top economic events on FX Leaders economic calendar
- Trade better, discover more Forex Trading Strategies
- Open a FREE Trading Account


