FTSE Stumbles Day After Bullish US Inflation Data Jolted Global Stocks Higher
The FTSE reached a new all-time high yesterday, but still ended in the red on the day. The boost from the expected decline in US inflation
The FTSE reached a new all-time high yesterday, but still ended in the red on the day. The boost from the expected decline in US inflation was short lived.
The FTSE set a new record yesterday, when it briefly touched 8480 before closing at 8440. The market had been in a steep rally on declining UK inflation and the perception that the BoE would cut rates sooner than later.
The perception of an early rate cut was strengthened last Thursday thanks to another board member of the MPC adding his vote for a rate cut at the last policy meeting. The market is still pricing in a rate cut from the BoE for September.
This seems the likeliest date as Bailey’s last comments were in line with observing that inflation was declining. But also, further declines were necessary before implementing a rate cut. The Fed is also expected to cut rates in September, which would make a BoE rate cut even more likely.
Technical View
The day chart below for the FTSE shows a strong bullish trend that may just have hit a high. Yesterday’s candle is a small upside-down hammer, which indicates a correction is likely. I doubt there will be a change in the overall trend, but lower levels seem possible.
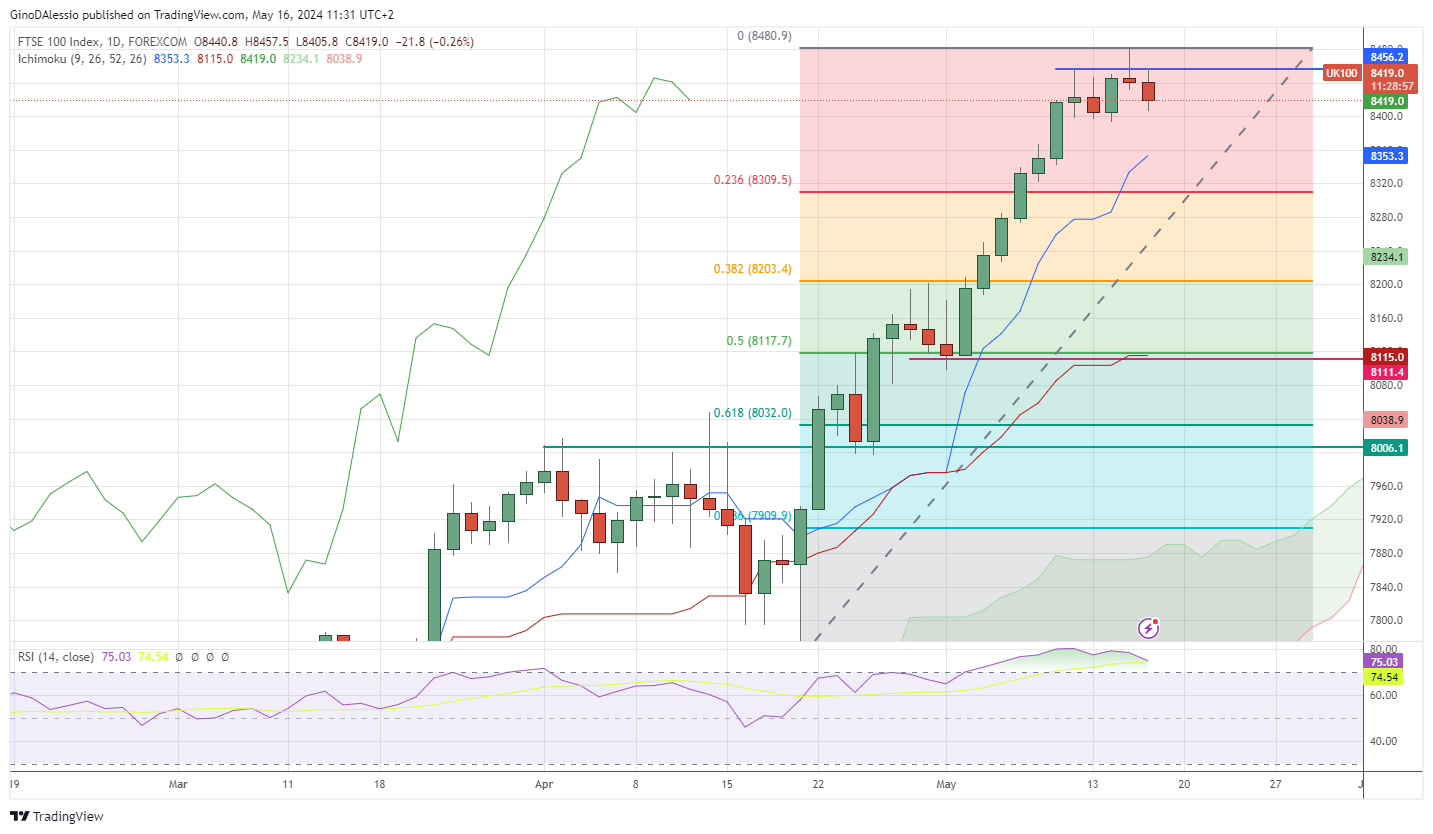
The market has risen steeply and drifted far away from the Ichimoku cloud. The market prices are like an elastic attached to the cloud; there’s only so far prices can go before they swing back toward the cloud.
The RSI has been well above 70 for the past 10 sessions, indicating the strength of the rally. However, it has been declining for the 3 sessions, and a break below 70 would indicate further retracement is likely.
The next support area is at the 0.236 level of the Fibonacci retracement tool, at 8309. While for the bull trend to take over again, we would need to see a close above the ATH of 8480.
- Check out our free forex signals
- Follow the top economic events on FX Leaders economic calendar
- Trade better, discover more Forex Trading Strategies
- Open a FREE Trading Account
