S&P 500, DJIA, and NASDAQ Enter Correction Phase: Key Insights and Forecasts

The recent market analysis underscores the potential for further downside movement. Last week, major indices including the S&P 500, Dow Jones Industrial Average, and Nasdaq Composite achieved new all-time highs, only to face corrections this week.
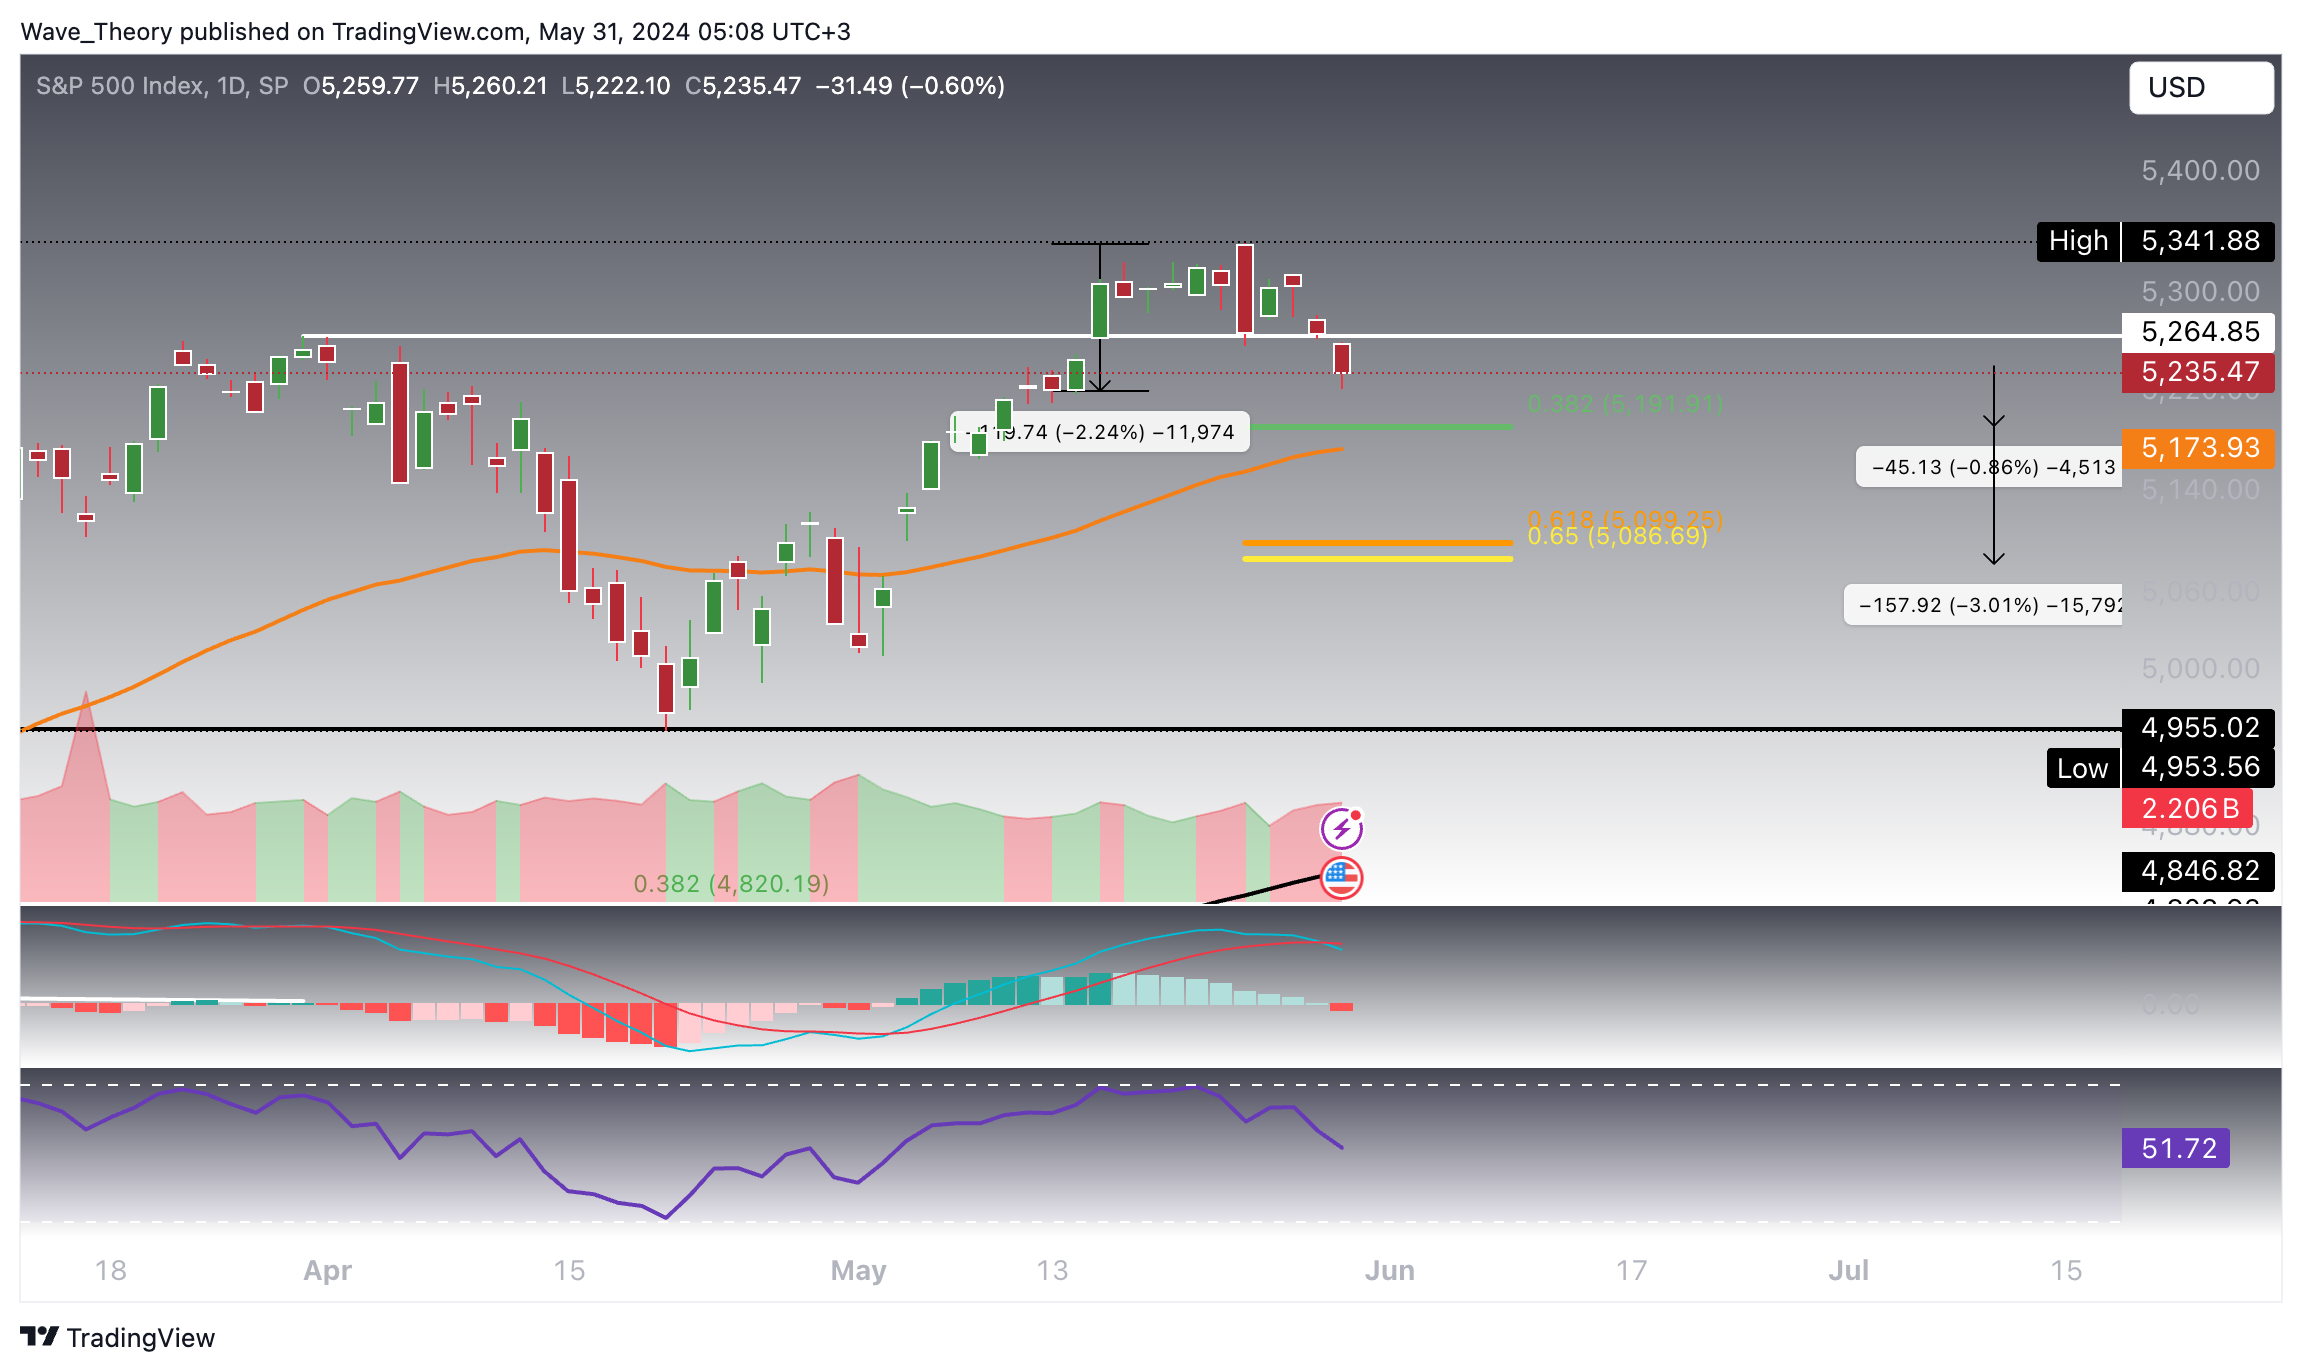
S&P 500 (SPX) Encounters 2.24% Correction with Additional Downward Risks
Following its peak at approximately 5,342 last week, the S&P 500 is now trending towards its next significant Fibonacci support at 5,192. The 50-day EMA also provides additional support at 5,174. Should this level not sustain, the SPX could find its next major Fibonacci support at 5,099, indicating potential further declines of up to 3%. Concurrently, the MACD lines have crossed bearishly and the histogram trends lower, while the RSI remains non-committal.
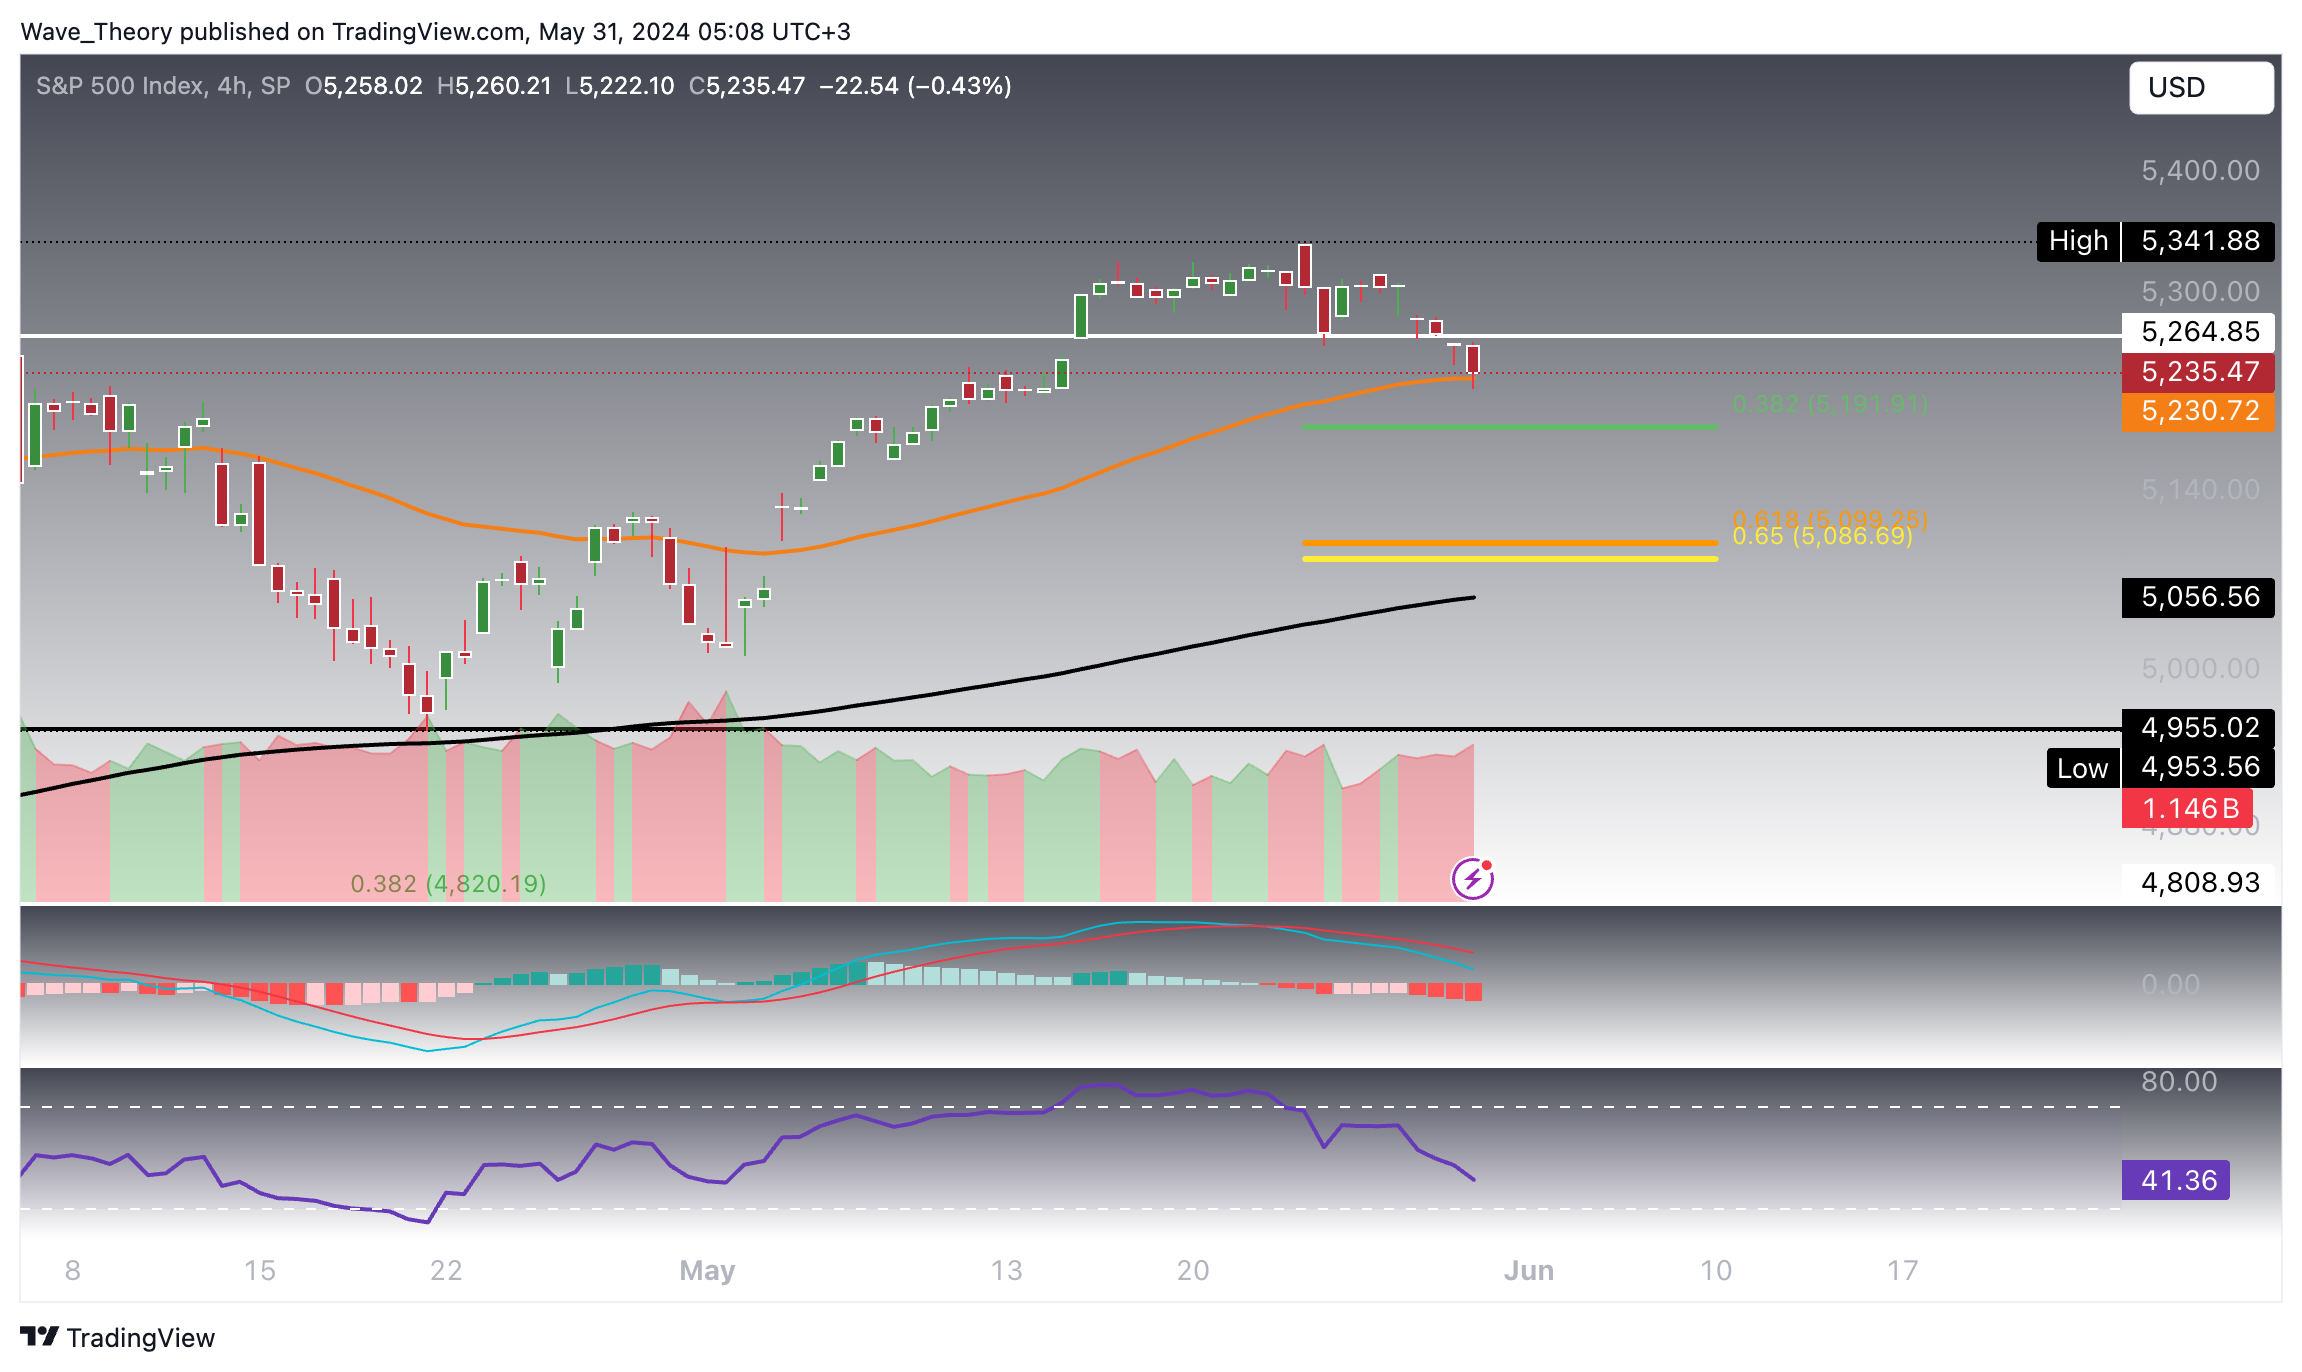
In both daily and 4-hour charts, while the golden crossover of the EMAs affirms a bullish trend, the SPX is currently undergoing a short-term correction phase, encountering immediate support at 5,230 marked by the 50-4H EMA. Despite this, bearish signs persist with the MACD lines crossed negatively and the histogram decreasing, as the RSI stays neutral. The index might rebound from the Fibonacci support, initiating a potential upward trajectory.
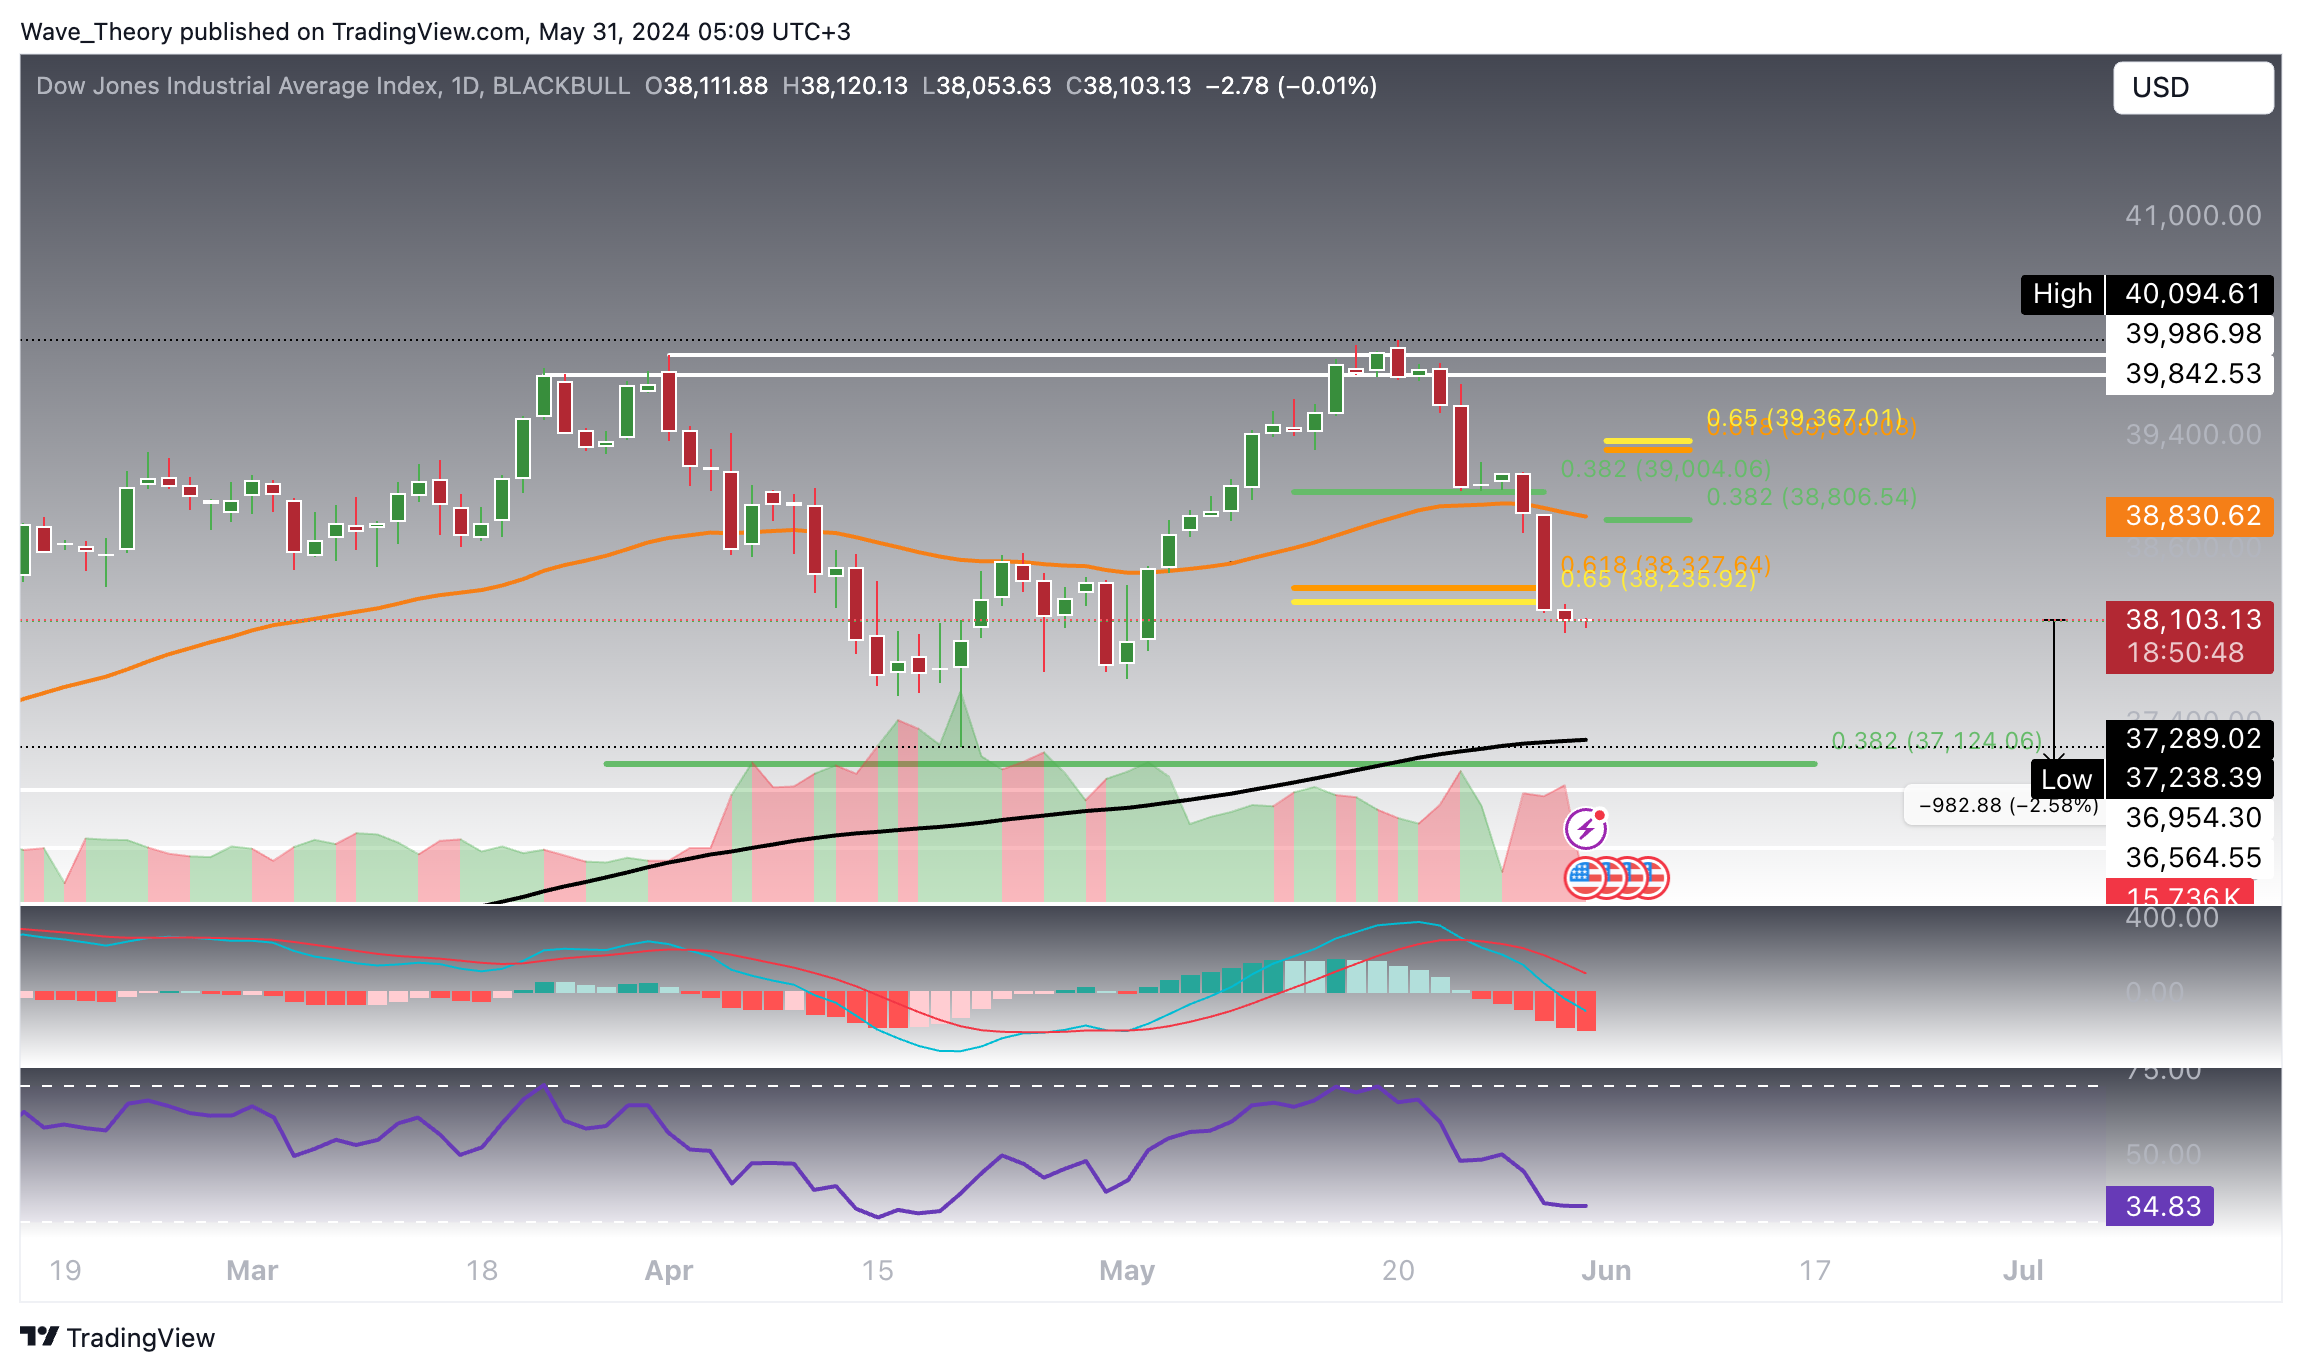
Dow Jones Industrial Average (DJI) Faces Significant Technical Challenges
The DJI (US30) initially pulled back from 40,095 to the 0.382 Fibonacci support at 39,004, where it momentarily rebounded. However, it soon resumed its downward course, breaching the crucial golden ratio support at 38,236. This move suggests a likely further decline of approximately 2.6% to the next significant Fibonacci support at 37,124, where the 200-day EMA offers additional support. Although the daily chart exhibits a golden crossover, bearish indicators prevail as the MACD lines and histogram continue their descent, with the RSI offering ambiguous direction.
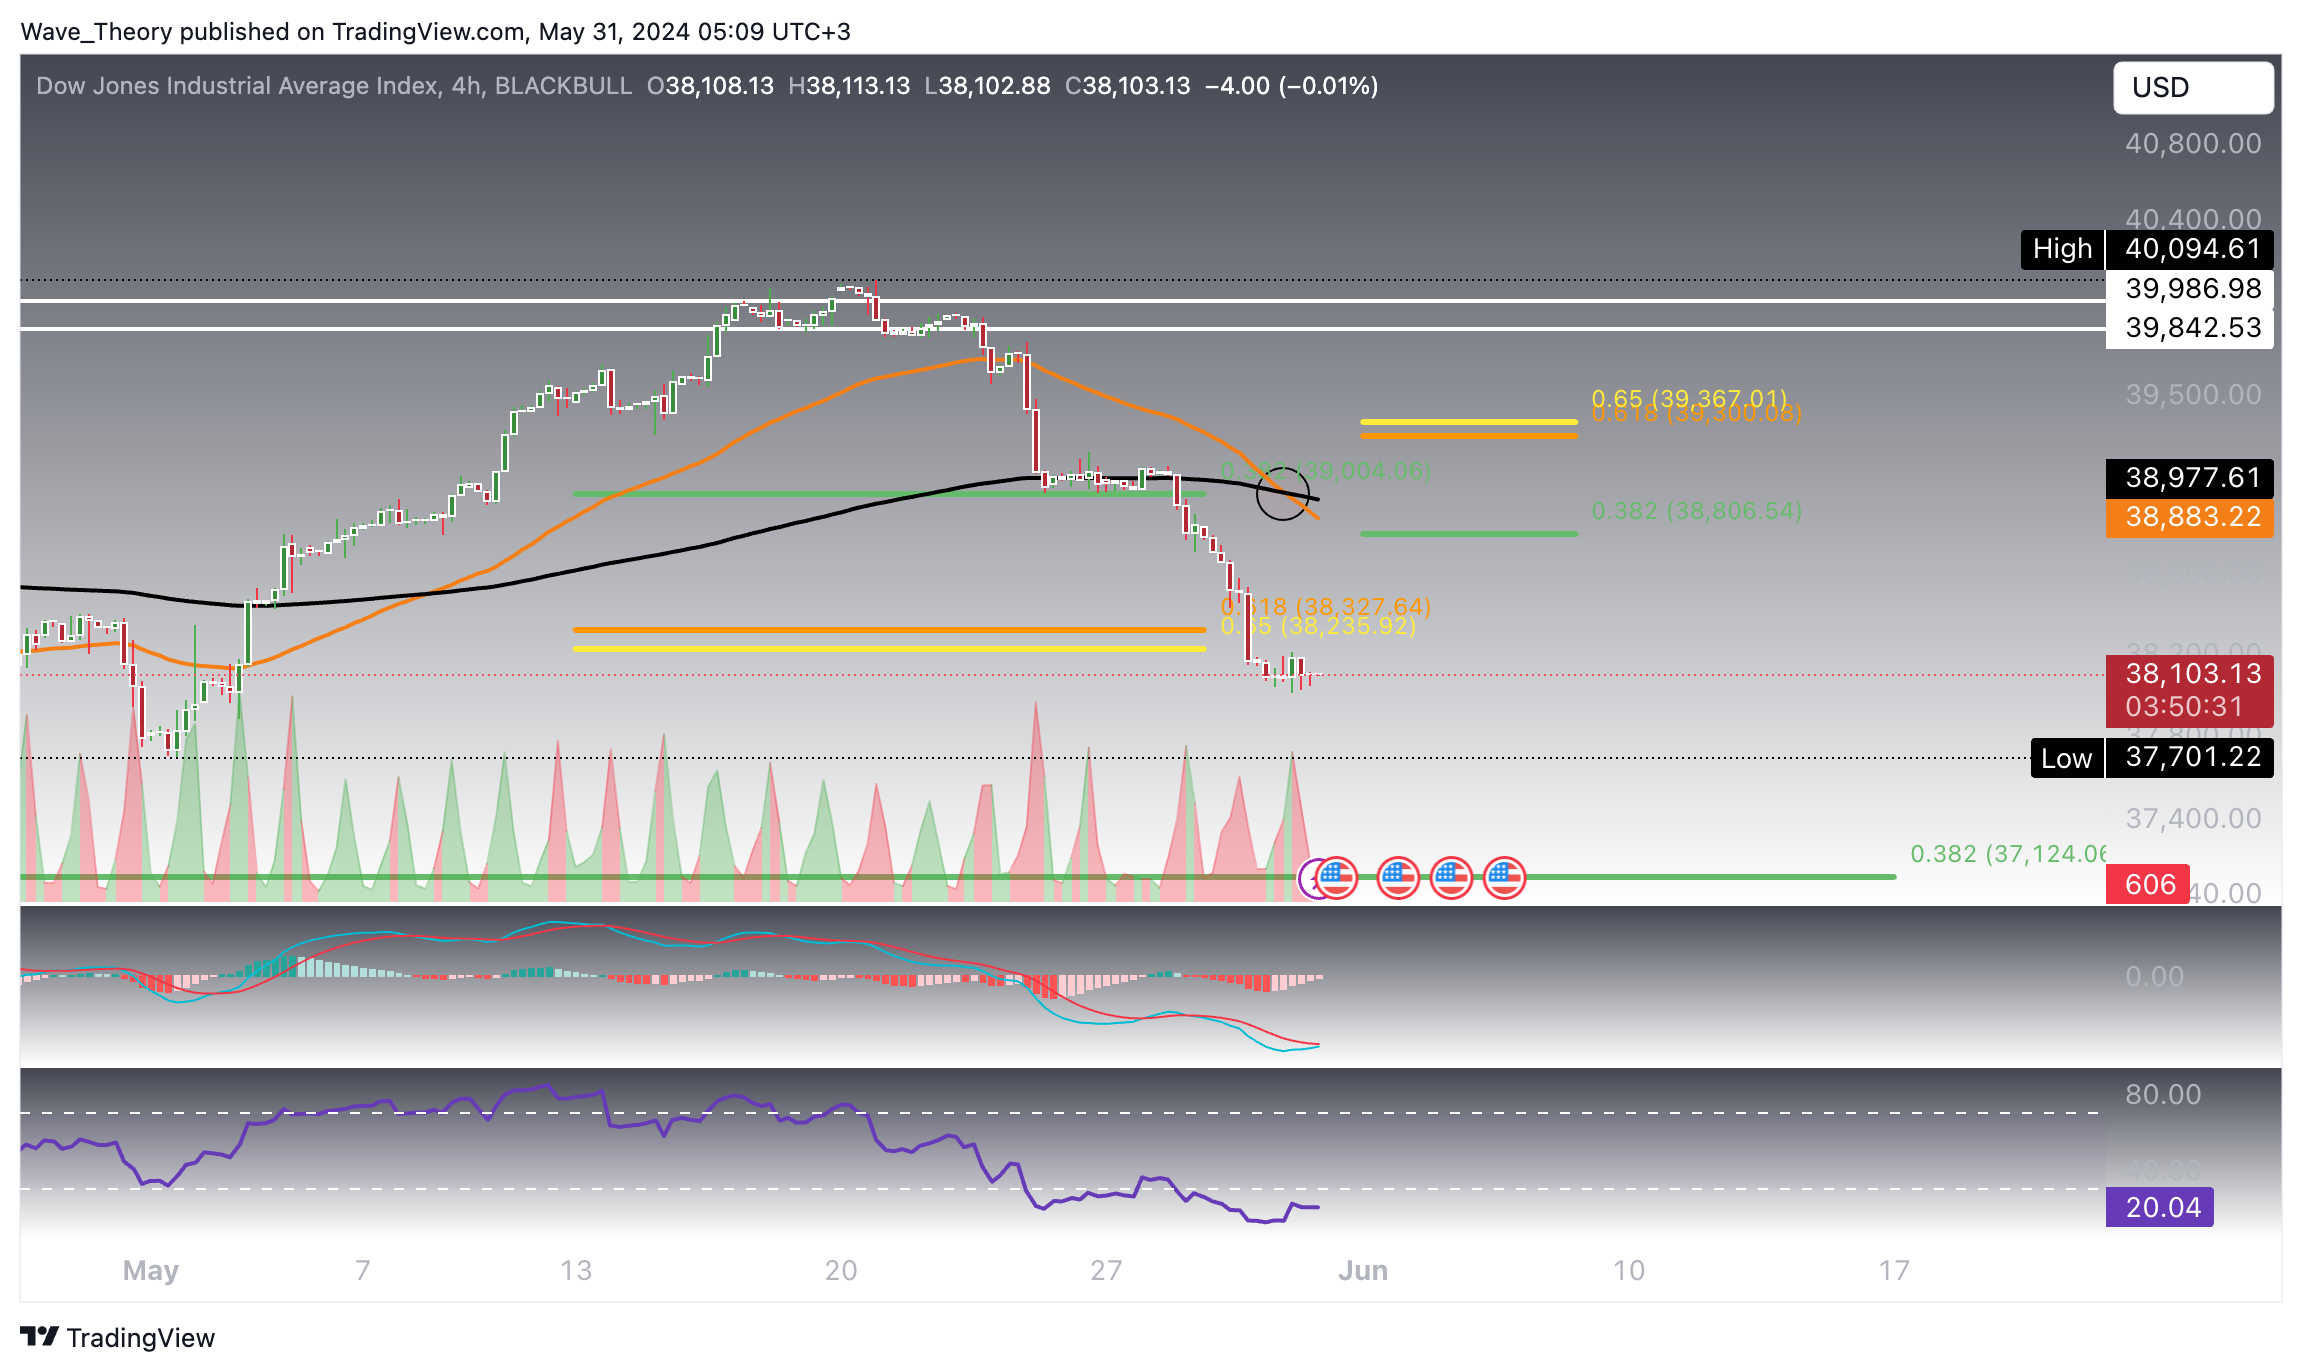
In the 4-hour framework, the emergence of a death cross denotes a bearish trend, albeit the histogram of the MACD shows a bullish uptick and an impending bullish crossover. This signals a potential for an upward movement, which will face substantial resistance at the 0.382 Fibonacci level at 38,806 and the golden ratio at 39,300.
Nasdaq Composite in a Correction Trajectory
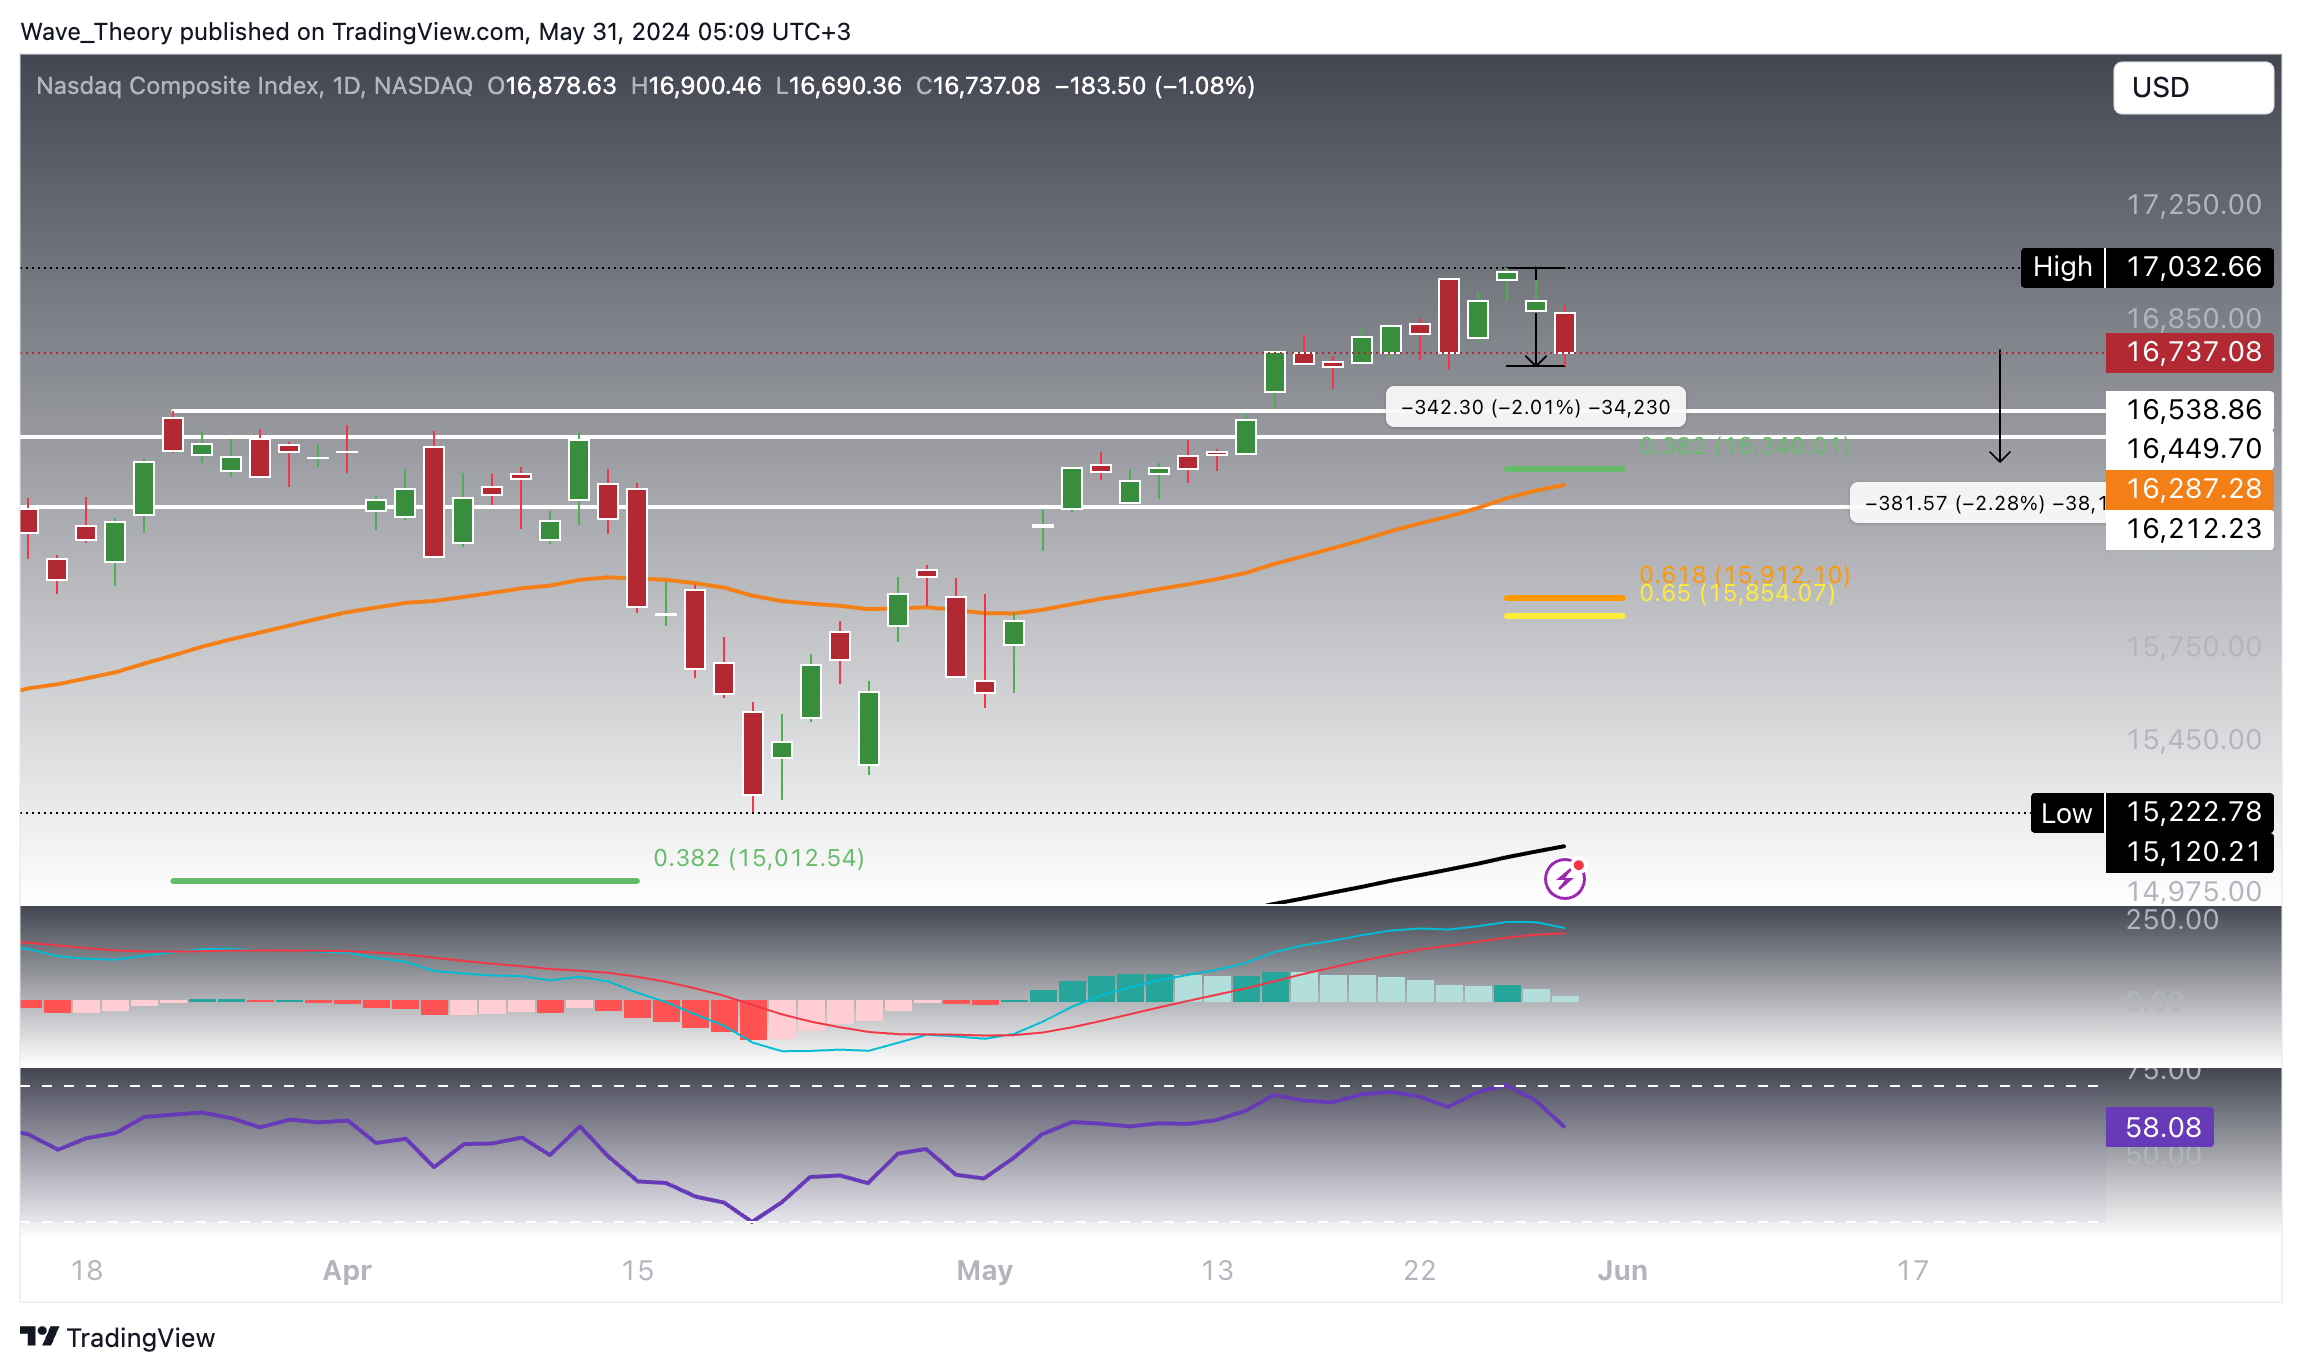
The Nasdaq Composite (IXIC) is currently down by approximately 2%, with further corrections in sight. It approaches a significant support zone between 16,450 and 16,539, with additional Fibonacci supports at 16,340 and 15,850. The 50-day EMA also lends support at 16,287. Bearish signals in the daily chart indicate potential continuation of the correction phase, with the MACD histogram trending lower and an anticipated bearish crossover, while the RSI remains neutral. The Nasdaq could face further declines of around 2.3% reaching the 0.382 Fibonacci support at 16,340.
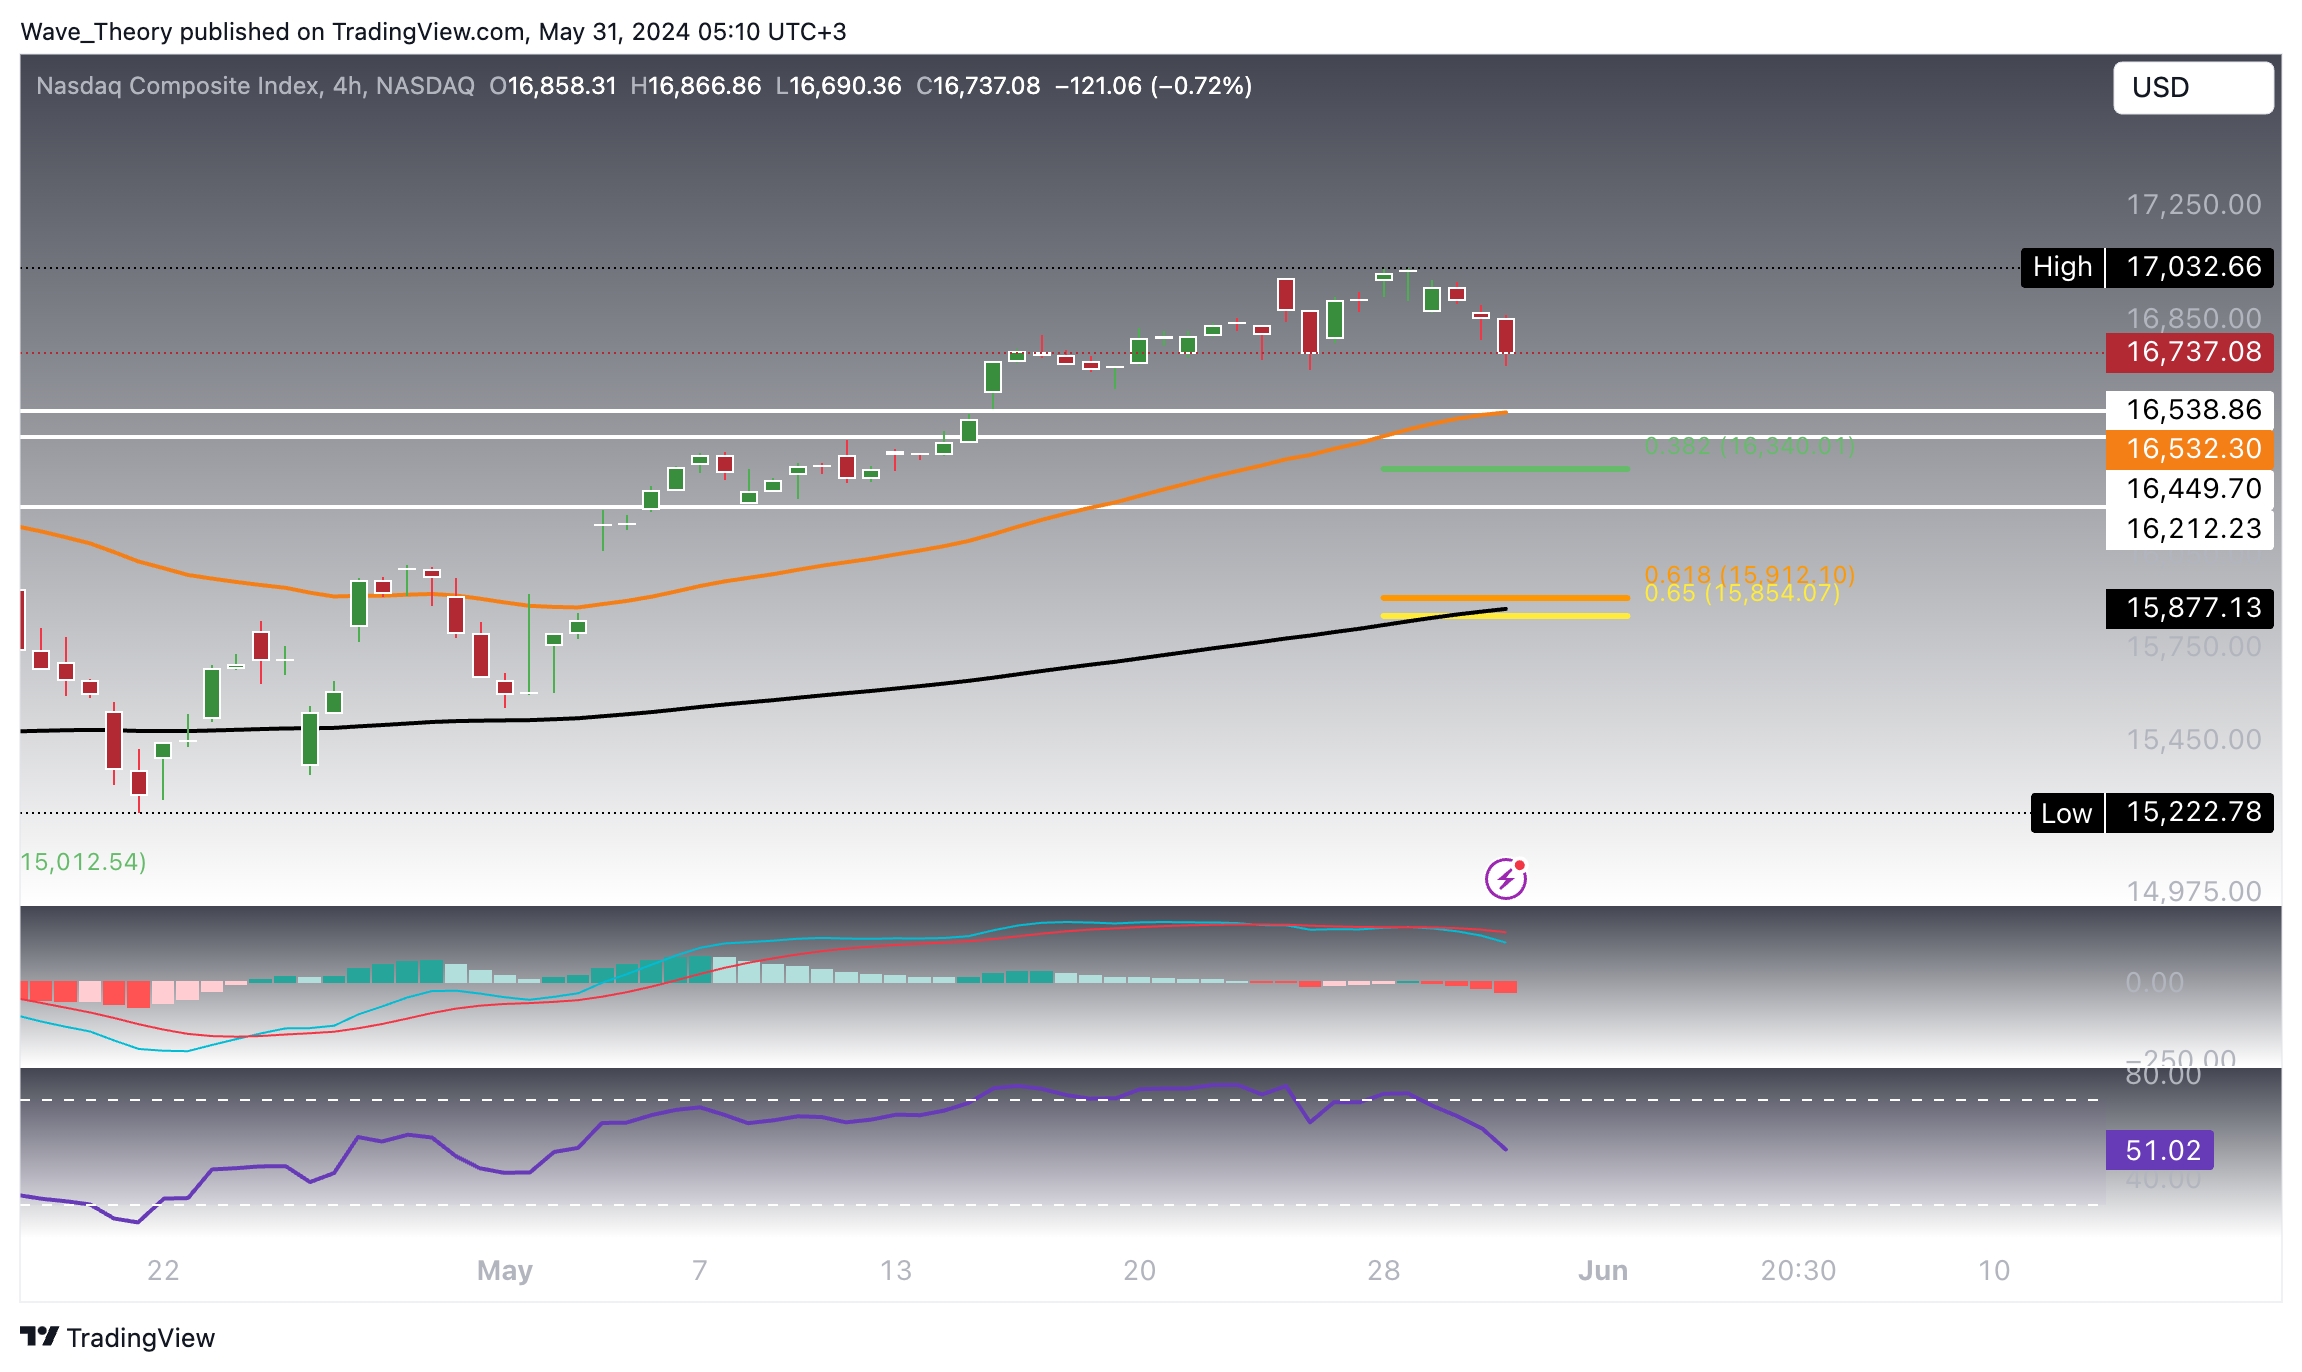
In the 4-hour chart, despite bearish crossings in the MACD lines and a descending histogram, the bullish confirmation by the golden crossover in the EMAs provides a conflicting signal, suggesting a possible bullish respite amidst the ongoing correction.
This analysis continues to project a generally bullish long-term outlook for these indices, supported by robust technical indicators across various time frames, suggesting a propensity to test or surpass previous highs. Despite achieving new records, the possibility of a continuing correction in the short term should not be overlooked.
- Check out our free forex signals
- Follow the top economic events on FX Leaders economic calendar
- Trade better, discover more Forex Trading Strategies
- Open a FREE Trading Account


