Dogecoin on Shaky Ground: Analyst Predictions Diverge While Technicals Signal Downturn
Dogecoin (DOGE), the undisputed king of meme coins, is experiencing a renewed decline after encountering resistance at $0.1285 against the
Dogecoin (DOGE), the undisputed king of meme coins, is experiencing a renewed decline after encountering resistance at $0.1285 against the US dollar. This downtrend coincides with a surge in short bets on DOGE, reflecting broader bearish sentiment in the meme coin sector.
DOGE/USD Technical Analysis Paints a Bearish Picture
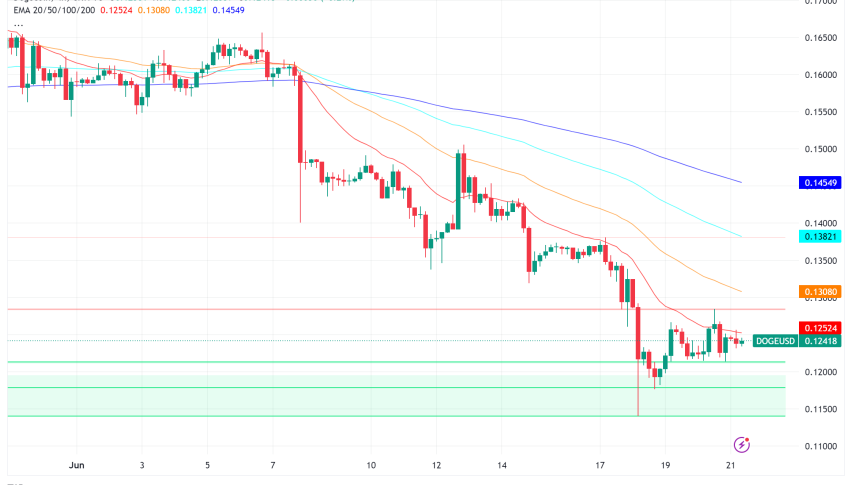
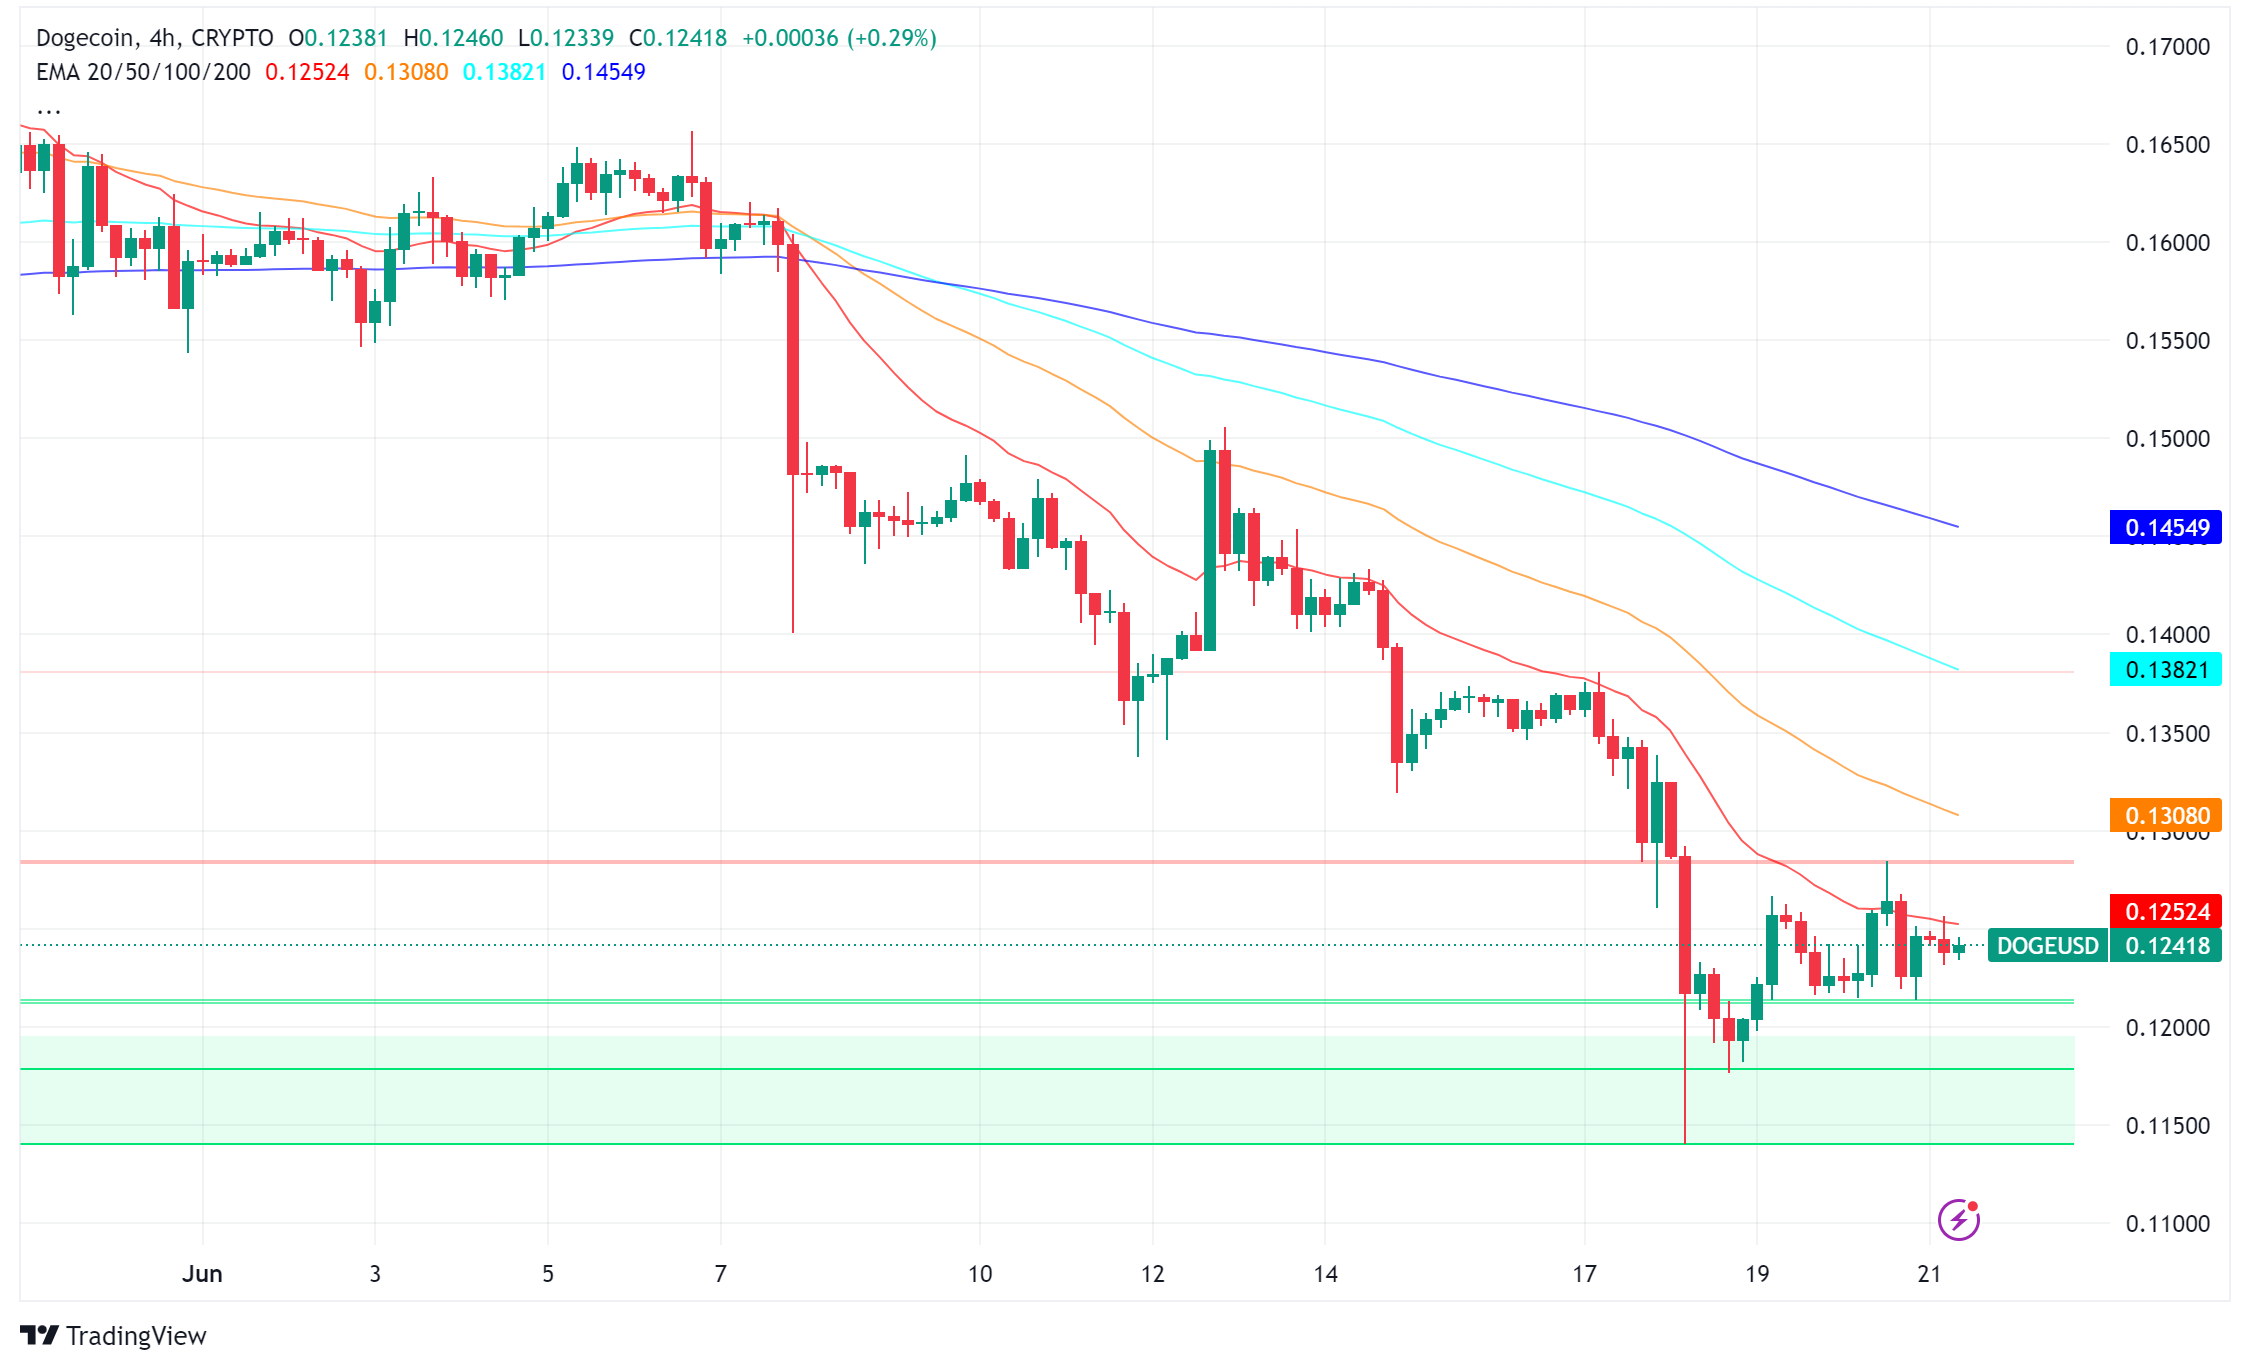
DOGE is currently consolidating around $0.1220, and a technical analysis suggests a potential continuation of the decline. The price is trading below the $0.1250 support zone and the crucial 100-hourly simple moving average.
Key Chart Patterns Indicate Downturn
An interesting observation is the formation of a key rising channel or, conversely, a bearish flag pattern on DOGE’s hourly chart. This pattern typically precedes a price drop, with support residing near $0.1220.
Bulls Need to Reclaim Key Levels for Reversal
For a bullish reversal to take hold, DOGE must decisively climb above $0.1260 and recapture the $0.1285 resistance level. This move would signal a shift in momentum and potentially pave the way for a fresh upswing.
Analyst Opinions Divided on DOGE’s Future
While the technical outlook appears bearish, some analysts remain optimistic about DOGE’s long-term prospects. Crypto analyst Trader Tardigrade predicts a significant price surge, with DOGE reaching a staggering $7.50. However, others like Kevin (formerly Yomi OG) express caution due to the loss of all daily moving averages, suggesting a potential short-to-medium term downtrend if these averages aren’t reclaimed.
Resistance Levels to Watch
If the bulls manage to regain control, they’ll face initial resistance at $0.1260, followed by a more substantial hurdle at $0.1285. A decisive break above $0.1285 could propel DOGE towards $0.1350 and potentially even higher to $0.1420 or $0.150.
Support Levels and Potential Downside
Conversely, a failure to surpass $0.1285 could lead to a continuation of the downtrend. The initial support level sits at $0.1220, followed by $0.1185. A breach of $0.1185 could trigger a sharper decline towards $0.1120.
Technical Indicators Reinforce Bearish Bias
The Moving Average Convergence Divergence (MACD) indicator for DOGE/USD is currently gaining momentum in the bearish zone, aligning with the overall downtrend. Similarly, the Relative Strength Index (RSI) sits below 50, signifying weak buying pressure.
- Check out our free forex signals
- Follow the top economic events on FX Leaders economic calendar
- Trade better, discover more Forex Trading Strategies
- Open a FREE Trading Account