Ethereum Prepares for Potential Price Surge: Analyzing Bullish Signals
Ethereum, the world’s second-largest cryptocurrency by market cap, is displaying signs of an imminent price increase as several technical

Ethereum, the world’s second-largest cryptocurrency by market cap, is displaying signs of an imminent price increase as several technical indicators suggest a bullish trend.

This article delves into the critical signals that forecast a possible upward trajectory for Ethereum and examines the implications for its future price movement.
Technical Analysis: Bullish Indicators Highlight Growth Potential
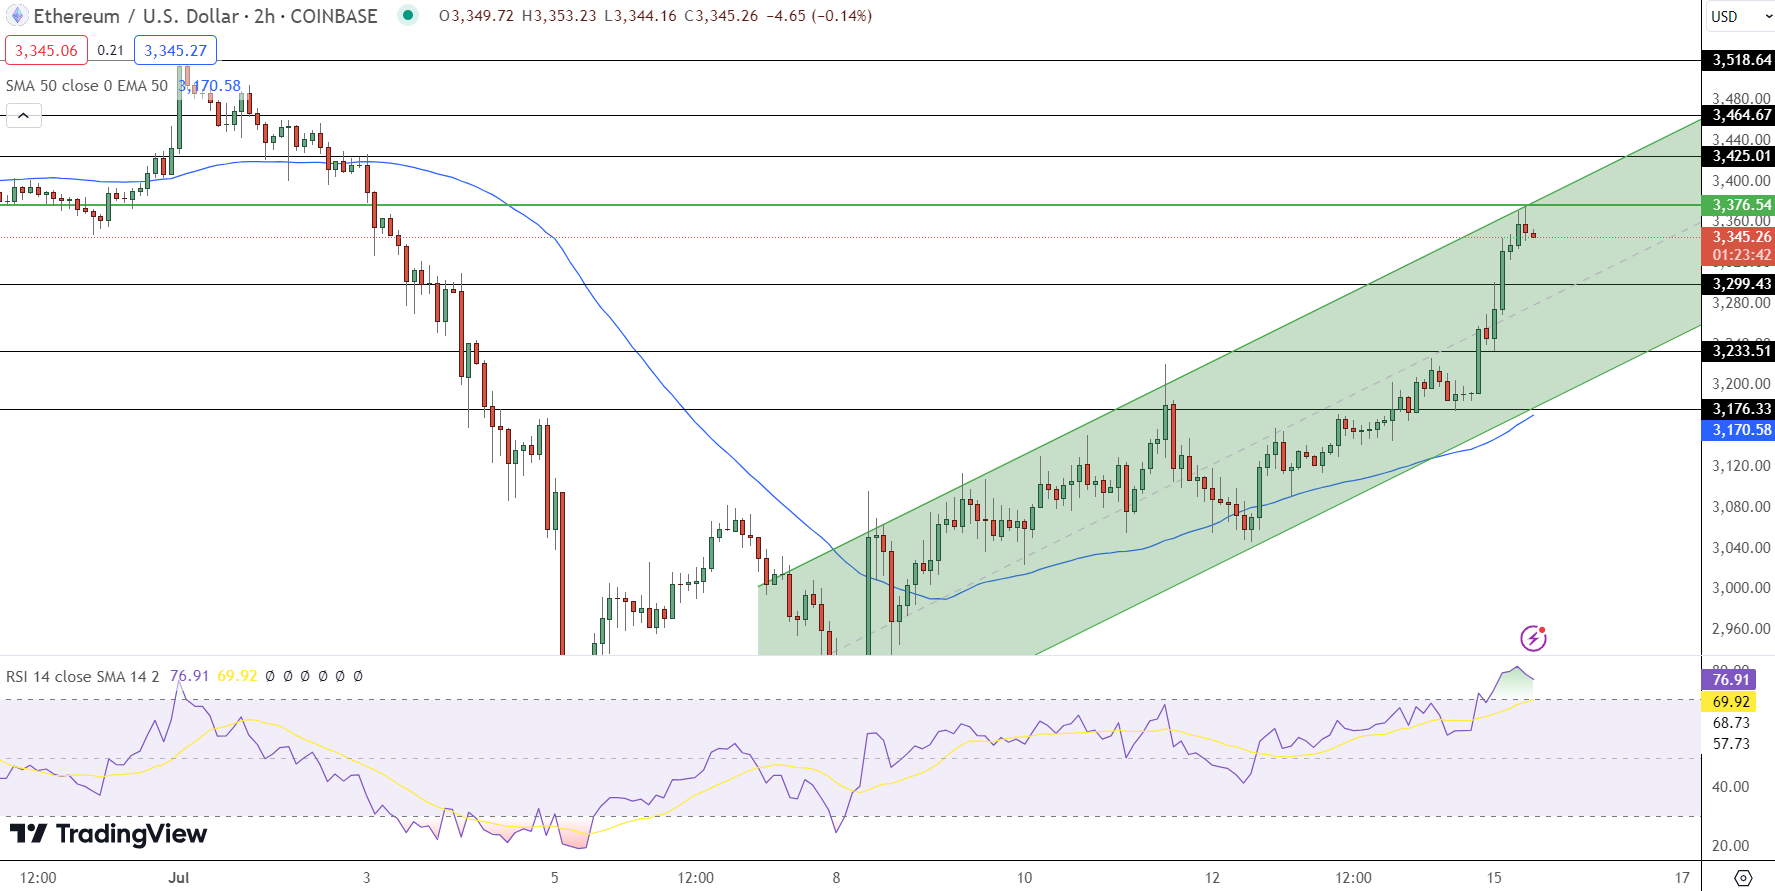
On the 4-hour chart, Ethereum’s price shows bullish momentum, inching towards the 100-day Simple Moving Average (SMA) and a bearish trendline. Since surpassing the $3,051 threshold, Ethereum has maintained a robust bullish stance, hinting at a possible rally towards the $3,360 resistance level.
Here is the 4 hour chart for SOL. SOL is top on the list to have an ETF after the Ethereum's ETF is approved. The price will be targeting $256 with a successful breakout of this pattern. pic.twitter.com/wRjGrad5Ve
— Crypto guru (@the1cryptoguru) July 2, 2024
The 4-hour Relative Strength Index (RSI) is also indicative of rising bullish momentum, as it advances towards the overbought territory, reinforcing the potential for upward movement.
Despite trading below the 100-day SMA and the bearish trendline on the daily chart, Ethereum is making strides towards the $3,360 resistance mark. This progress is further evidenced by the daily RSI, which has exited the oversold zone, approaching a neutral 50%, suggesting sustained bullish conditions.
Evaluating Ethereum’s Ascension
Following its breach of the $3,051 mark, Ethereum has demonstrated significant resilience, consistently trading above this level.
#Squarespace disclosed a breach affecting multiple domain registrations following its acquisition of #Google Domains' customer base. The breach, discovered on or around July 10, 2024, has left numerous domains compromised by an unidentified threat actorhttps://t.co/67QDQzc3Ql
— Gray Hats (@the_yellow_fall) July 15, 2024
A decisive break above the daily SMA and bearish trendline could catalyze a bullish rally towards the $3,360 mark. If Ethereum successfully closes above this resistance, it could set the stage for further ascents towards $3,659 and potentially even the $3,975 mark.
Conversely, should Ethereum face resistance at $3,360, it might retreat towards the $3,051 support level. A further downturn could see Ethereum testing the $2,865 support level, with additional declines possible if this threshold is breached.
Current Market Position
As of now, Ethereum’s price stands at approximately $3,156, marking a 2.73% increase in the past 24 hours. The cryptocurrency boasts a market capitalization of over $379 billion and a trading volume exceeding $11 billion.
Despite a notable 24-hour increase of 2.77% in market cap, there has been a 27.64% reduction in trading volume, indicating fluctuating investor interest.
This analysis highlights the importance of closely monitoring Ethereum’s key resistance and support levels to understand its potential price movements. With its strong market position and bullish indicators, Ethereum is gearing up for potentially significant price movements soon.
- Check out our free forex signals
- Follow the top economic events on FX Leaders economic calendar
- Trade better, discover more Forex Trading Strategies
- Open a FREE Trading Account
- Read our latest reviews on: Avatrade, Exness, HFM and XM
Related Articles


Sidebar rates
Related Posts
