XRP: A Closer Look at the Volume Spike
XRP has recently experienced a surge in trading volume, sparking interest and speculation within the cryptocurrency market. However, a
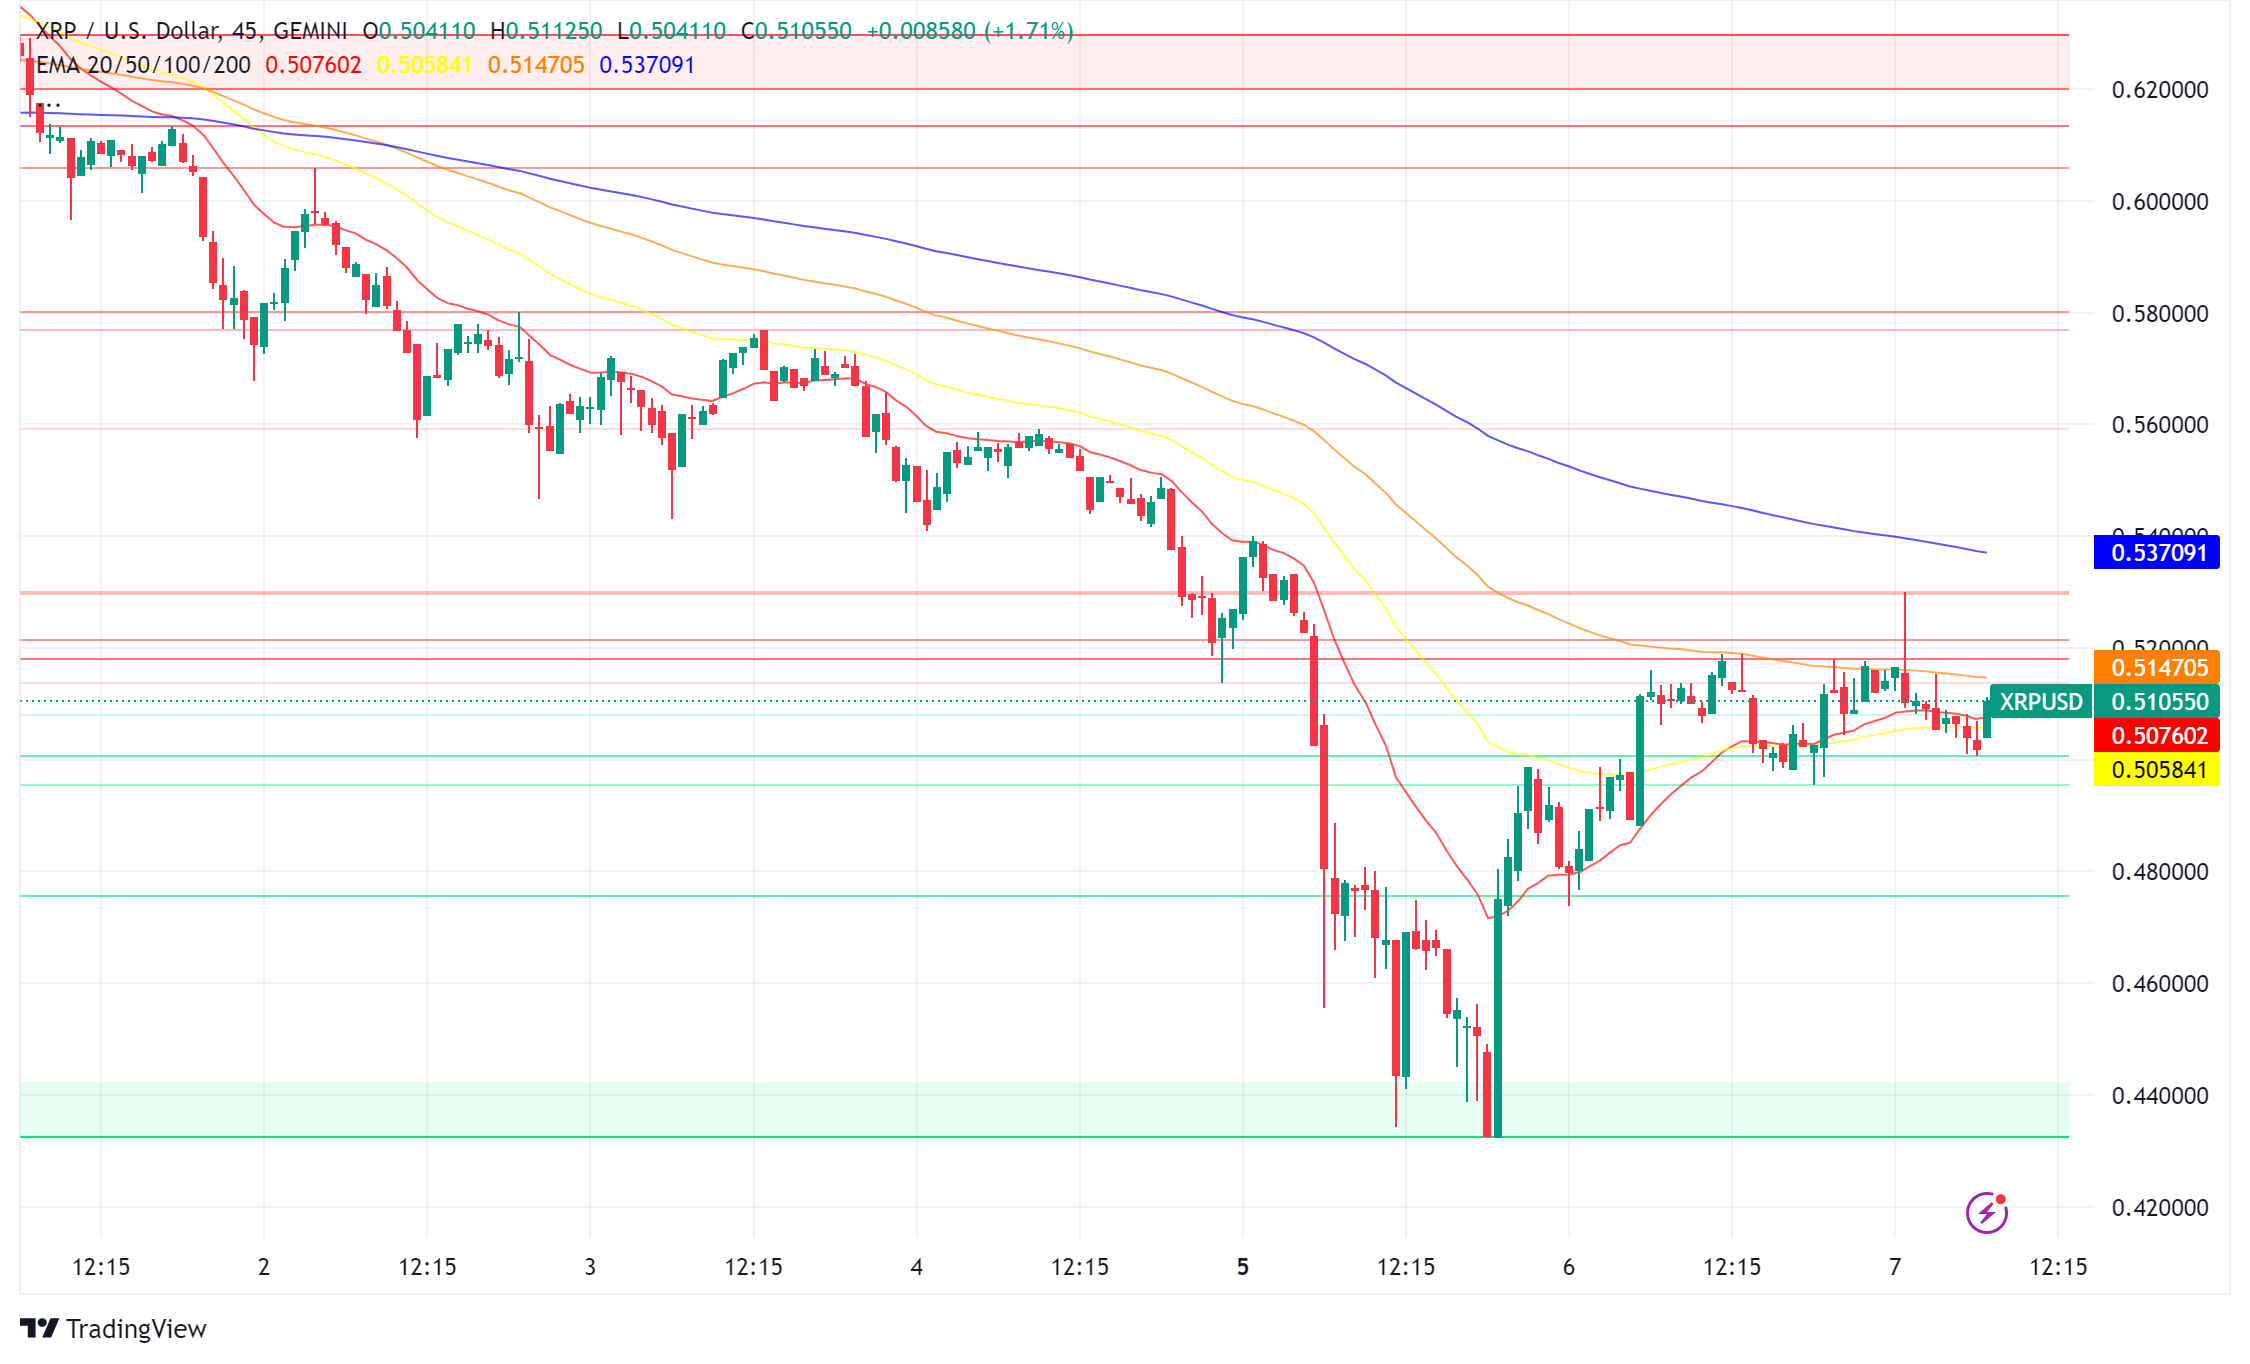
XRP has recently experienced a surge in trading volume, sparking interest and speculation within the cryptocurrency market. However, a deeper dive into the data reveals a more complex picture than initially perceived.
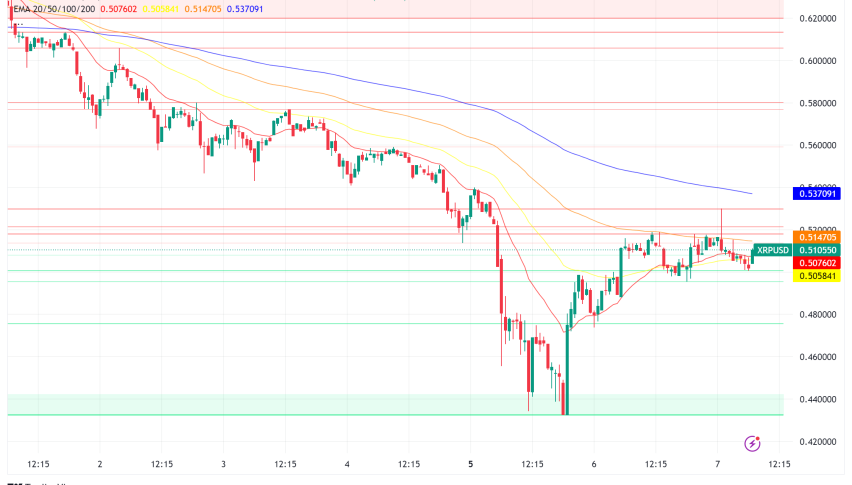
While the increased volume might suggest strong buying pressure, the reality is quite different. The price of XRP has remained relatively stagnant despite the heightened trading activity, indicating a prevalence of selling pressure. This discrepancy raises questions about the overall strength of XRP’s market position.
Selling Pressure Dominates
Analysis suggests that the volume spike is primarily driven by a significant amount of sell orders. This selling pressure has effectively countered any potential buying interest, keeping XRP’s price suppressed. Coupled with the broader bearish sentiment in the cryptocurrency market, investors appear cautious, potentially opting to liquidate their holdings amid uncertainty.
Challenges Ahead
XRP’s inability to break through significant resistance levels reflects the underlying lack of confidence in the market. The broader cryptocurrency market’s volatility, particularly with Bitcoin and Ethereum, has further exacerbated challenges for XRP to mount a sustained price recovery.
XRP Whale Activity and Potential Recovery
Despite the current market conditions, there are signs of potential optimism. Recent data indicates that large XRP holders, or whales, are accumulating the token. This increased buying activity could potentially support a price rebound.
Moreover, XRP has demonstrated resilience in the past, recovering from significant price drops. If the market sentiment shifts and XRP manages to hold above the critical $0.48 level, a 30% upside move is possible.
However, it’s essential to remain cautious. The market is highly volatile, and XRP’s price trajectory will depend on various factors, including overall market conditions, investor sentiment, and regulatory developments.
XRP/USD Technical Analysis
| Technical Indicator | Value | Description |
|---|---|---|
| Resistance Level | $0.71 | A price level at which selling pressure might increase, potentially halting or reversing an upward trend. |
| Support Level | $0.48 | A price level at which buying pressure might increase, potentially halting or reversing a downward trend. |
| Relative Strength Index (RSI) | 51.75 | A momentum indicator that measures the magnitude of recent price changes to evaluate if an asset is overbought (above 70) or oversold (below 30). At 51.75, XRP is currently in a neutral zone. |
| 10-day Simple Moving Average (SMA) | $0.51 | A technical indicator used to smooth price data by averaging the closing prices over a specific period. The 10-day SMA can act as a support or resistance level. In this case, it suggests a balanced market. |
| Potential Upside Move | 37% (if XRP breaks above $0.71) | The potential percentage increase in XRP’s price if it can surpass the resistance level of $0.71. |
- Check out our free forex signals
- Follow the top economic events on FX Leaders economic calendar
- Trade better, discover more Forex Trading Strategies
- Open a FREE Trading Account
