S&P 500 (SPX) and Dow Jones (DJI) Near Key Resistance: Mixed Signals Point to Potential Market Shift
Recent market analysis underscores potential for further upside movement, tempered by indicators cautioning about potential downside risks. This analysis examines the S&P 500 and Dow Jones Industrial Average both of which have recently reached new all-time highs.
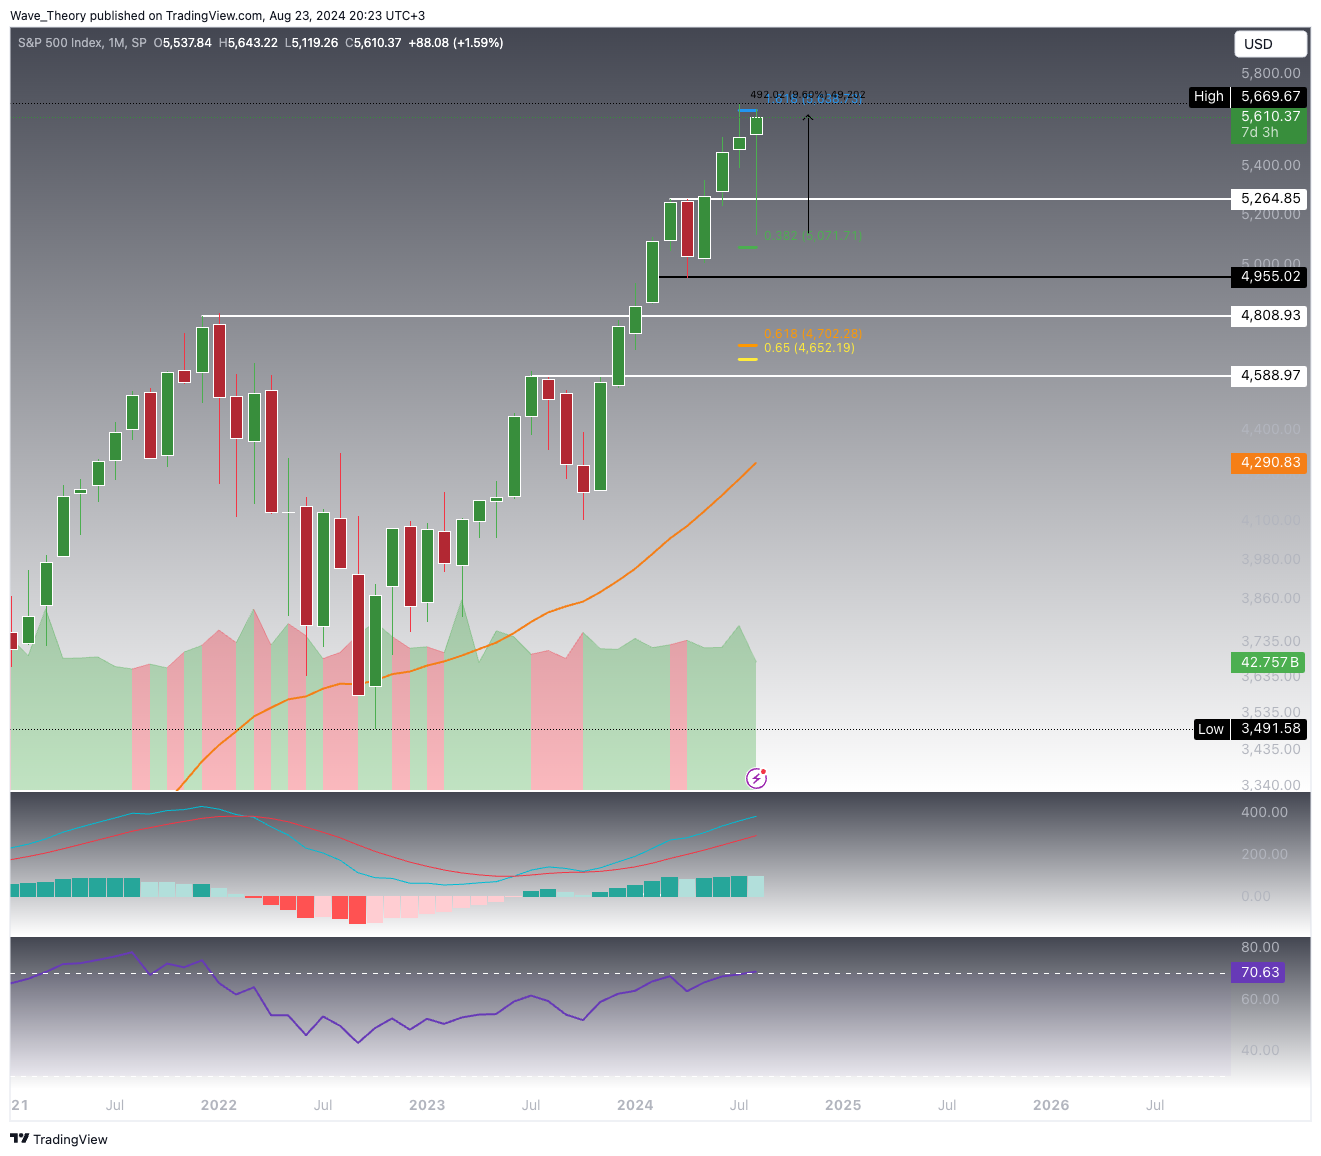
S&P 500 (SPX) Re-Tests Major Fibonacci Resistance, Surges Nearly 10 %
The S&P 500 (SPX) recently experienced a significant recovery after testing major Fibonacci support at approximately 5,072, surging nearly 10%. This recovery brings SPX back to the 1.618 Fibonacci projection level around 5,639, a key resistance point where it faced rejection last month.
Technical Indicators and Trends (Monthly Chart):
- MACD (Moving Average Convergence Divergence): The MACD lines remain bullishly crossed, signaling ongoing upward momentum, but the histogram has started to decline this month, indicating a potential deceleration in bullish momentum.
- RSI (Relative Strength Index): The RSI is nearing overbought levels without any bearish divergence, pointing to continued strength in the current uptrend.
- EMA (Exponential Moving Average): The golden crossover of the EMAs confirms a long-term bullish trend, reinforcing the positive outlook for SPX.
However, despite this robust recovery, the S&P 500 now encounters significant resistance. The monthly chart advises caution as SPX could face another rejection at this critical level.
S&P 500 (SPX) at Risk of Rejection: Critical Support Levels to Monitor
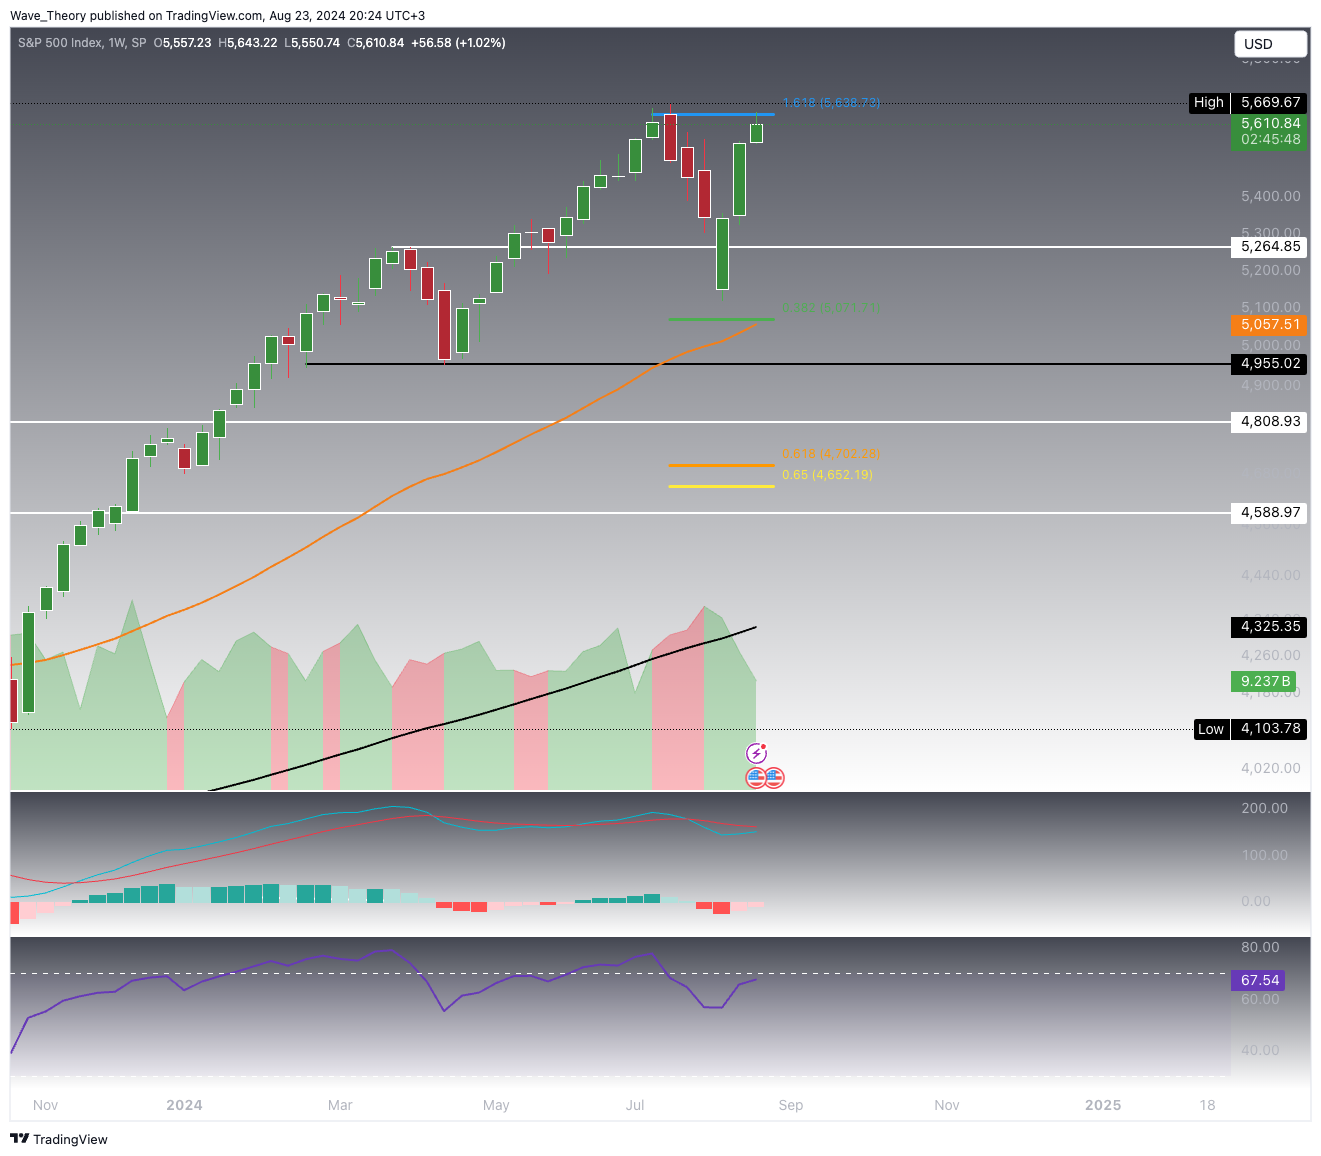
he SPX has exhibited a strong upward momentum over the past three weeks. However, should the index face rejection at the crucial Fibonacci resistance level of 5,639, the next significant support level lies around 5,265. If this support fails to hold, the S&P 500 may retrace to subsequent Fibonacci levels at 5,072 and 4,660, respectively. Additionally, the 50-week EMA at 5,057.5 serves as an extra layer of support.
The weekly chart reveals a mixed outlook:
Technical Indicators and Trends (Weekly Chart):
- MACD (Moving Average Convergence Divergence): Currently, the MACD lines are bearishly crossed, though there is potential for a bullish crossover as the histogram has been ticking higher since last week.
- RSI (Relative Strength Index): The RSI is approaching overbought territory, with the risk of forming a bearish divergence, which could signal a potential pullback if the SPX surpasses its all-time high and sets a new peak.
- EMA (Exponential Moving Average): The golden crossover of the EMAs reaffirms a mid-term bullish trend, bolstering the overall positive outlook for SPX.
Despite the recent bullish performance, traders should exercise caution as the RSI’s potential bearish divergence could temper enthusiasm around a new all-time high.
S&P 500 (SPX) Rejected at Key Fibonacci Level: What Traders Need to Know
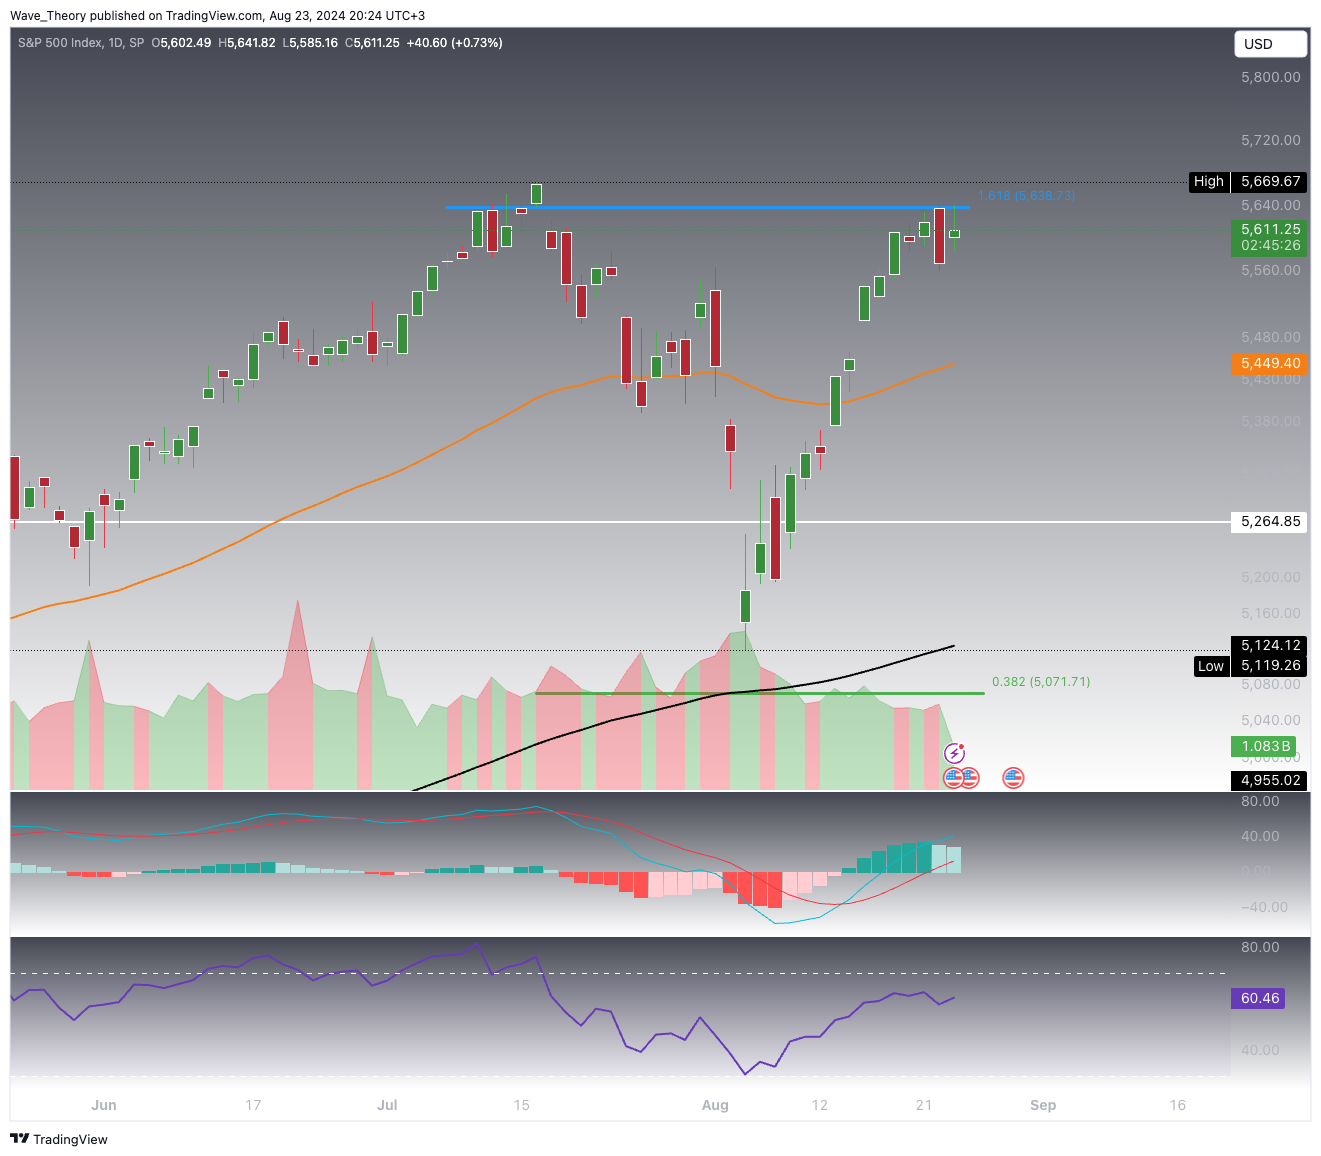
Yesterday, the S&P 500 encountered rejection at the Fibonacci projection level of 5,639. Despite attempts to break through, SPX appears to be struggling at this critical resistance point.
Technical Indicators and Trends (Daily Chart):
- MACD (Moving Average Convergence Divergence): The MACD lines remain bullishly crossed, though the histogram has been ticking lower since yesterday, signaling potential weakening momentum.
- RSI (Relative Strength Index): The RSI is currently in neutral territory, suggesting no clear directional bias at this time.
- EMA (Exponential Moving Average): The golden crossover of the EMAs continues to support a bullish trend in the short-to-medium term.
While the overall indicators remain largely bullish, some caution is warranted due to emerging warning signs on the daily chart.
Can S&P 500 (SPX) Rebound from Key Fibonacci Support Levels?
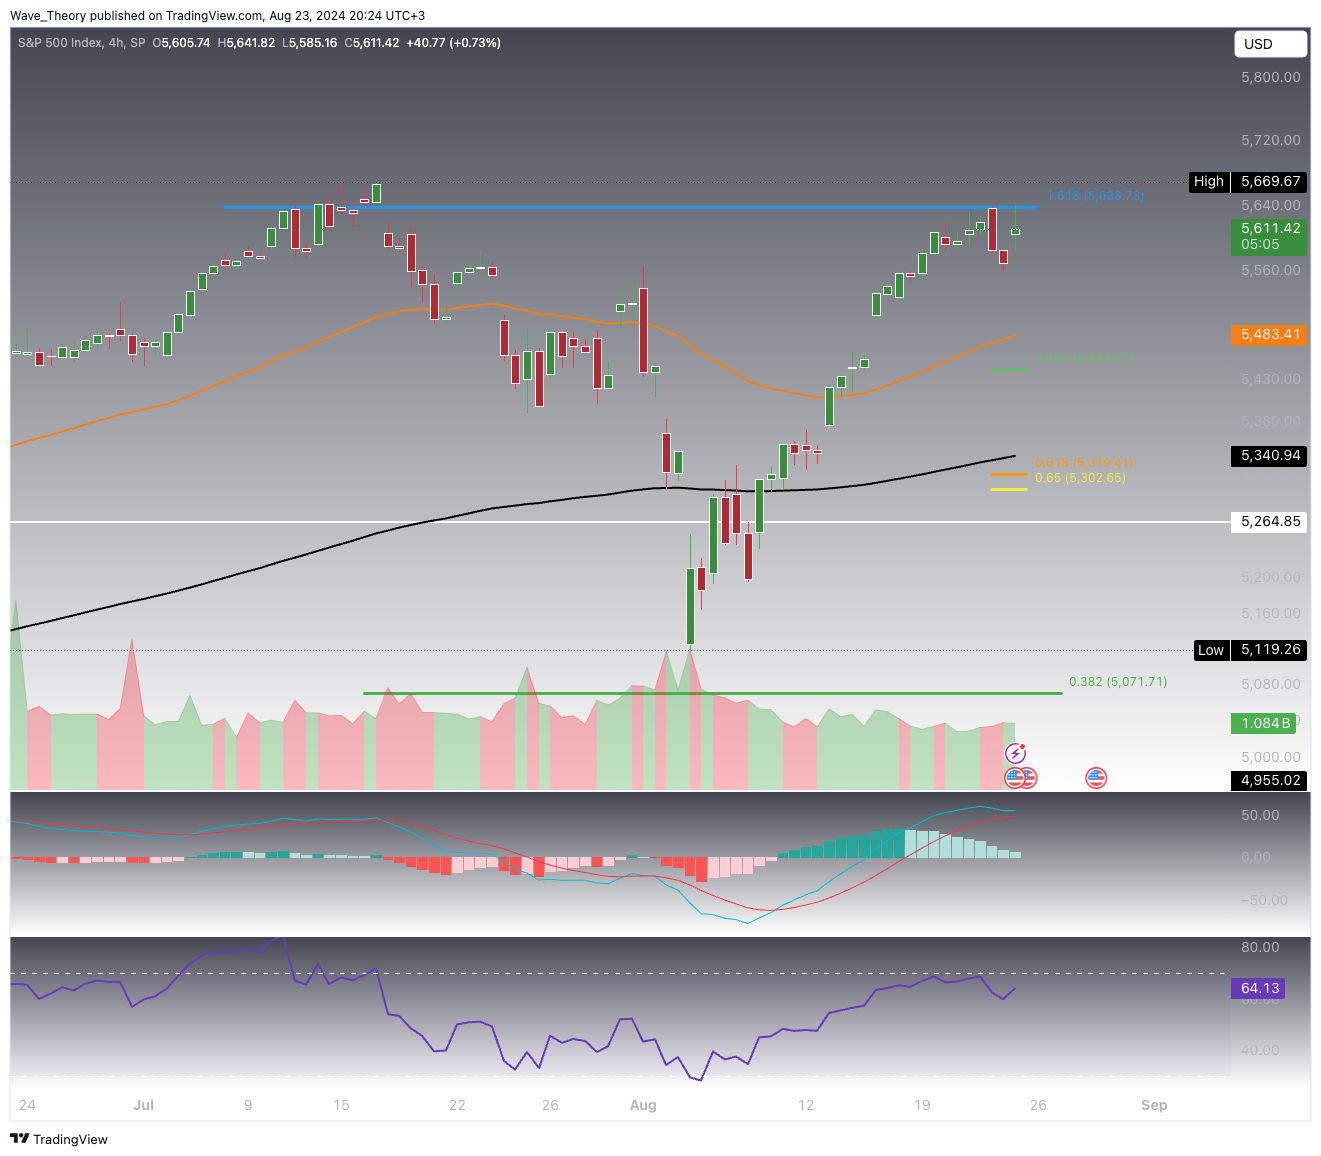
If SPX fails to break through the Fibonacci resistance, the next significant Fibonacci support levels to watch are 5,443 and 5,320.
Technical Indicators and Trends (4H Chart):
- MACD (Moving Average Convergence Divergence): The MACD is on the verge of a bearish crossover, with the histogram indicating a bearish trend.
- RSI (Relative Strength Index): The RSI remains in a neutral stance, hovering just below overbought territory.
- EMA (Exponential Moving Average): The golden crossover of the EMAs continues to confirm a short-term bullish trend.
Traders should closely monitor these levels and indicators as they provide key insights into the potential direction of SPX in the near term.
Dow Jones Industrial Average (DJI) Shows Similar Strength
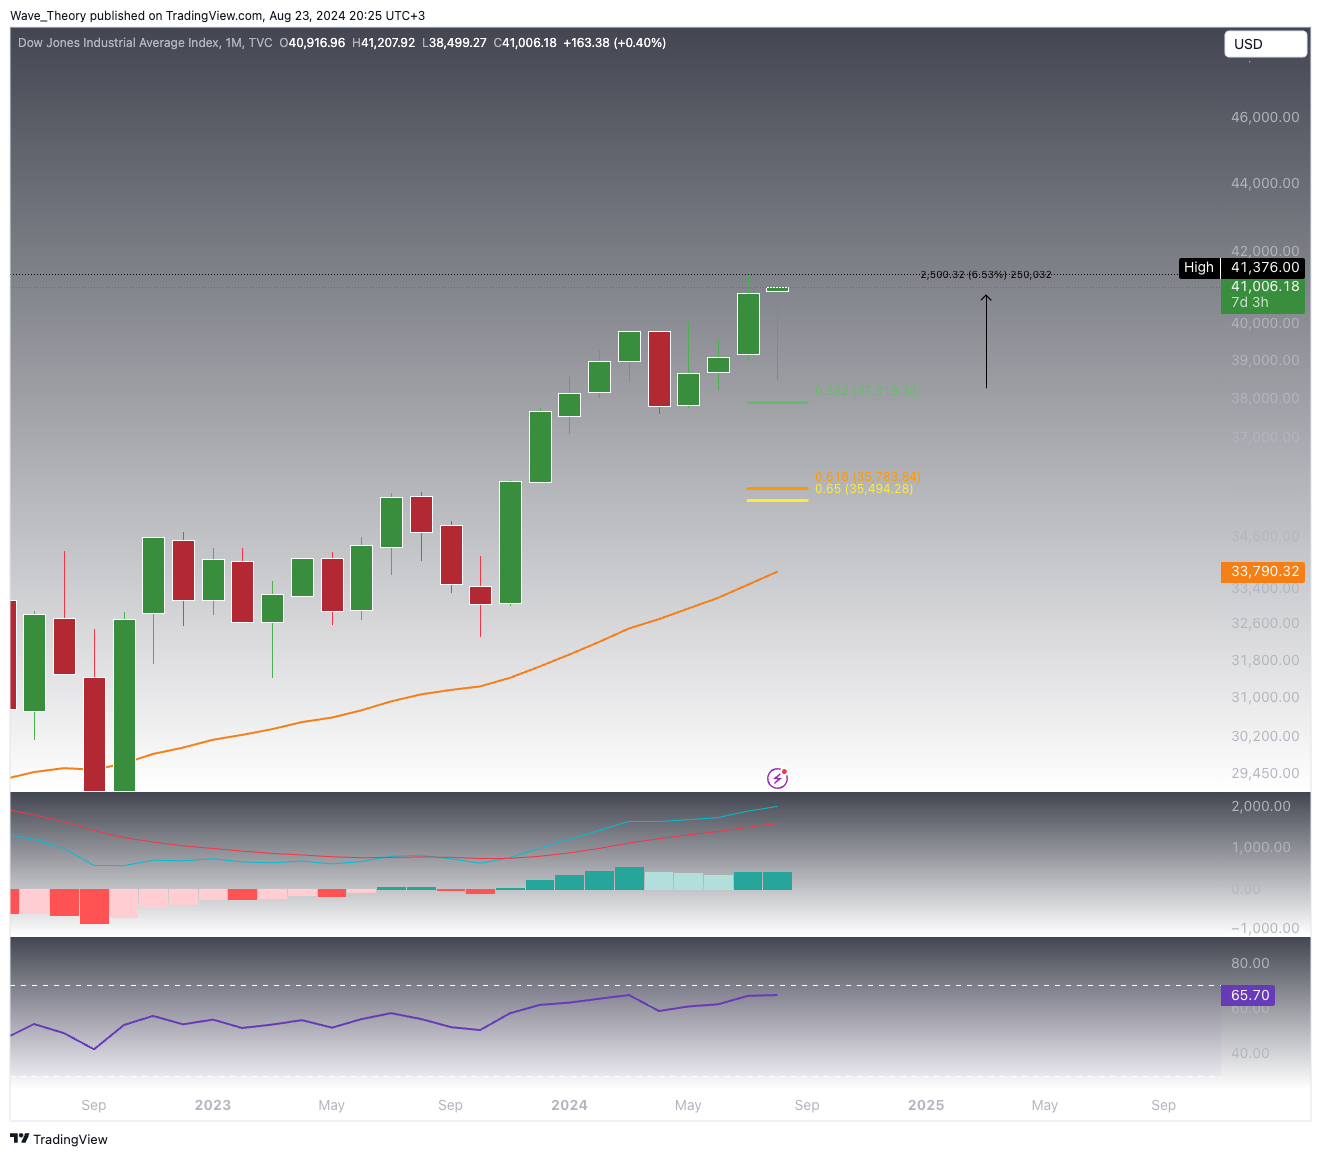
The Dow Jones Industrial Average (DJI) experienced a strong pullback earlier this month but has since recovered sharply, gaining 6.5% and approaching its all-time high established last month. Despite not reaching the 0.382 Fibonacci support at 37,919, the index has shown resilience in its recovery.
Technical Indicators and Trends (Monthly Chart):
- MACD (Moving Average Convergence Divergence): The MACD lines remain bullishly crossed, with the histogram ticking higher since last month, indicating continued upward momentum.
- RSI (Relative Strength Index): The RSI is nearing overbought levels, increasing the likelihood of eliminating the threat of a bearish divergence, which bodes well for sustained strength.
- EMA (Exponential Moving Average): The golden crossover of the EMAs reaffirms a long-term bullish trend, further solidifying the positive outlook for the DJI.
These indicators suggest that the DJI maintains a strong bullish bias, with the potential for further gains as it approaches its previous high.
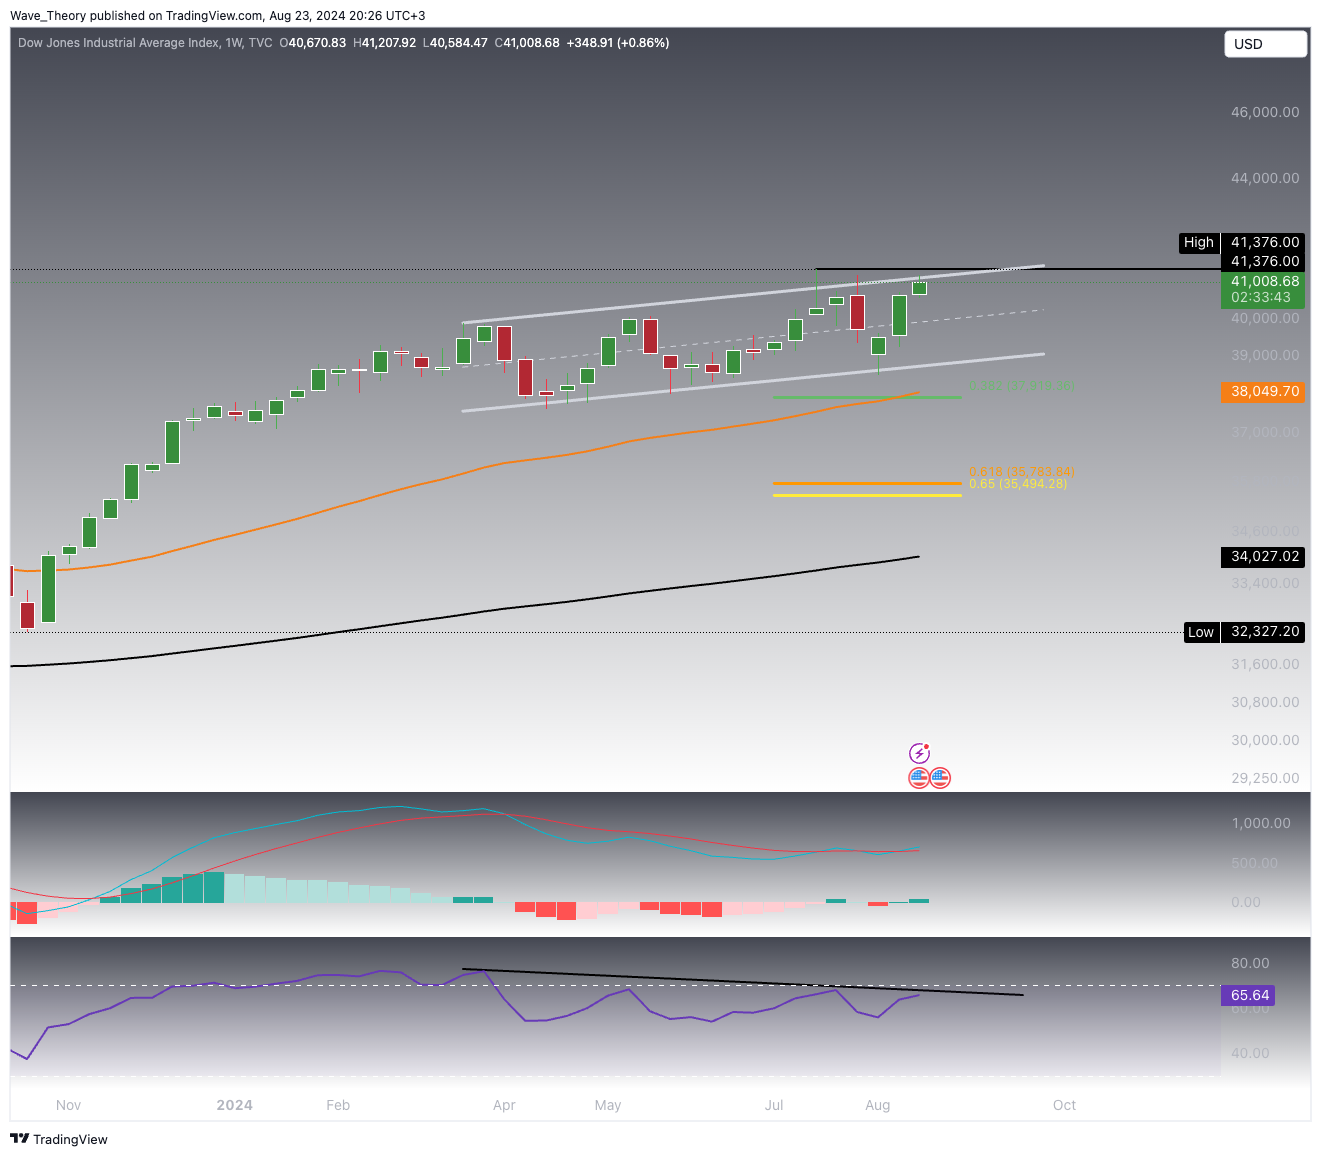
Dow Jones Industrial Average (DJI) Is Trending In An Upward Channel
Technical Indicators and Trends (Weekly Chart):
- MACD (Moving Average Convergence Divergence): The MACD lines have recently crossed bullishly, with the histogram ticking higher since last week, indicating strengthening upward momentum.
- RSI (Relative Strength Index): The RSI displays an intact bearish divergence trendline, cautioning traders about a potential pullback as momentum may be waning.
- EMA (Exponential Moving Average): The golden crossover of the EMAs confirms a mid-term bullish trend, reinforcing the positive outlook for the DJI.
While the overall trend remains bullish, the presence of a bearish divergence in the RSI suggests that traders should remain vigilant for potential signs of a pullback, particularly as the DJI approaches key resistance levels.
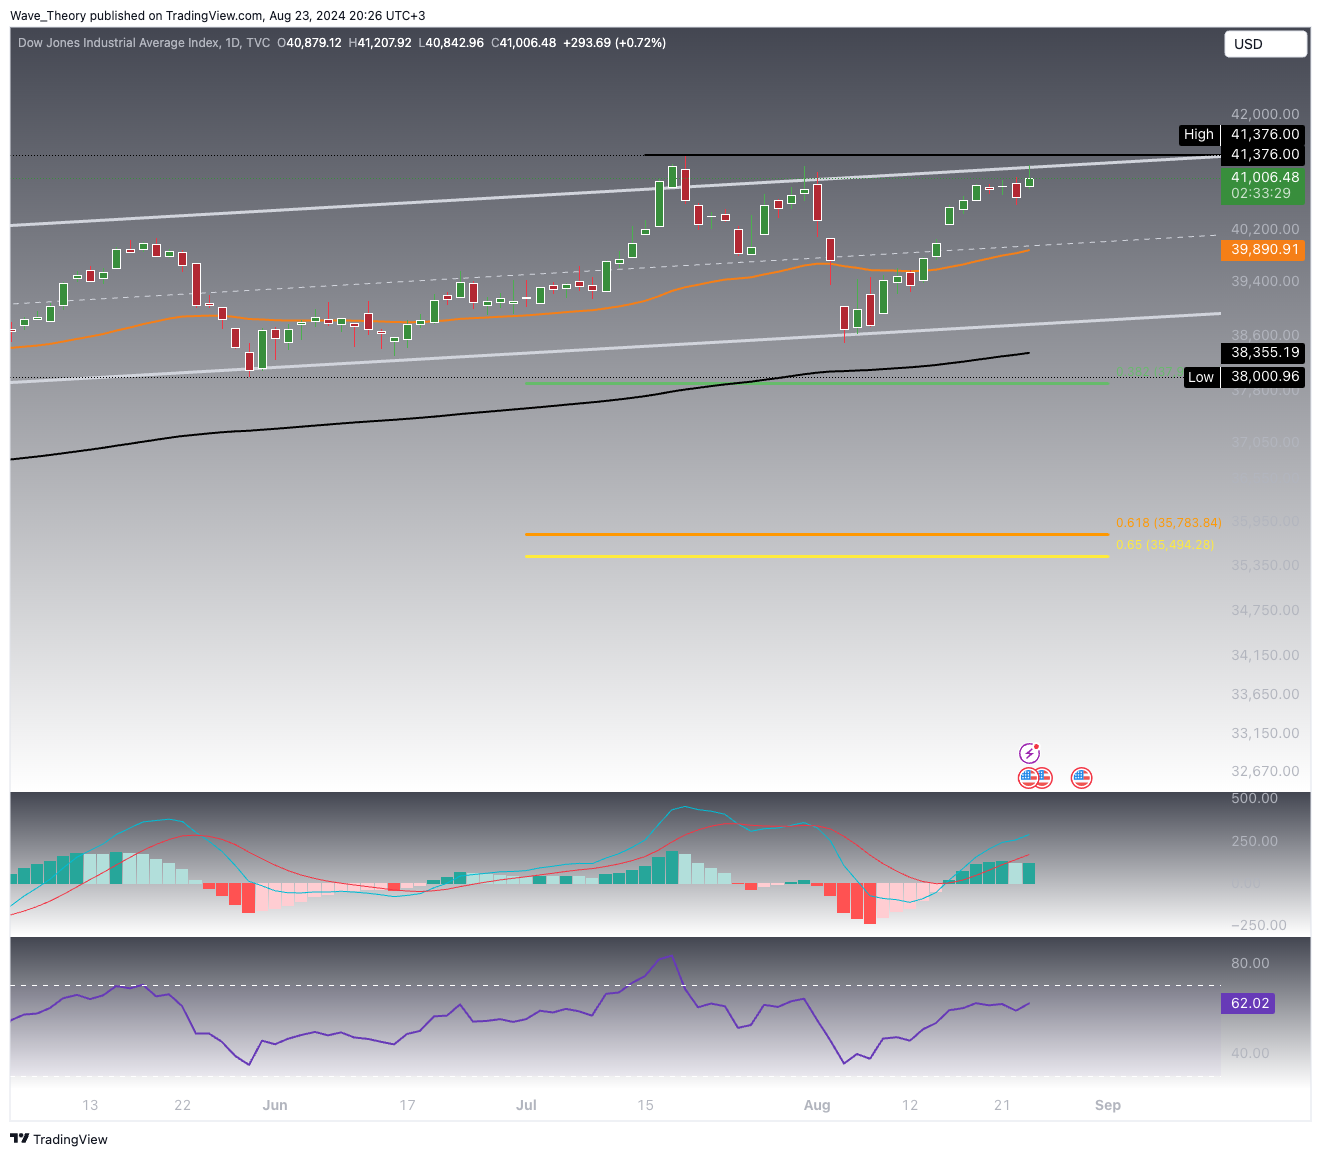
Dow Jones Industrial Average (DJI) Daily Chart Signals Strong Bullish Momentum
On the daily chart, the indicators present a predominantly bullish outlook.
Technical Indicators and Trends (Daily Chart):
- MACD (Moving Average Convergence Divergence): The MACD lines remain bullishly crossed. While the histogram ticked lower yesterday, it has started to tick higher again today, indicating renewed bullish momentum.
- RSI (Relative Strength Index): The RSI continues to hover in neutral territory, providing no definitive directional signals at this time.
- EMA (Exponential Moving Average): The golden crossover of the EMAs reaffirms a bullish trend in the short-to-medium term.
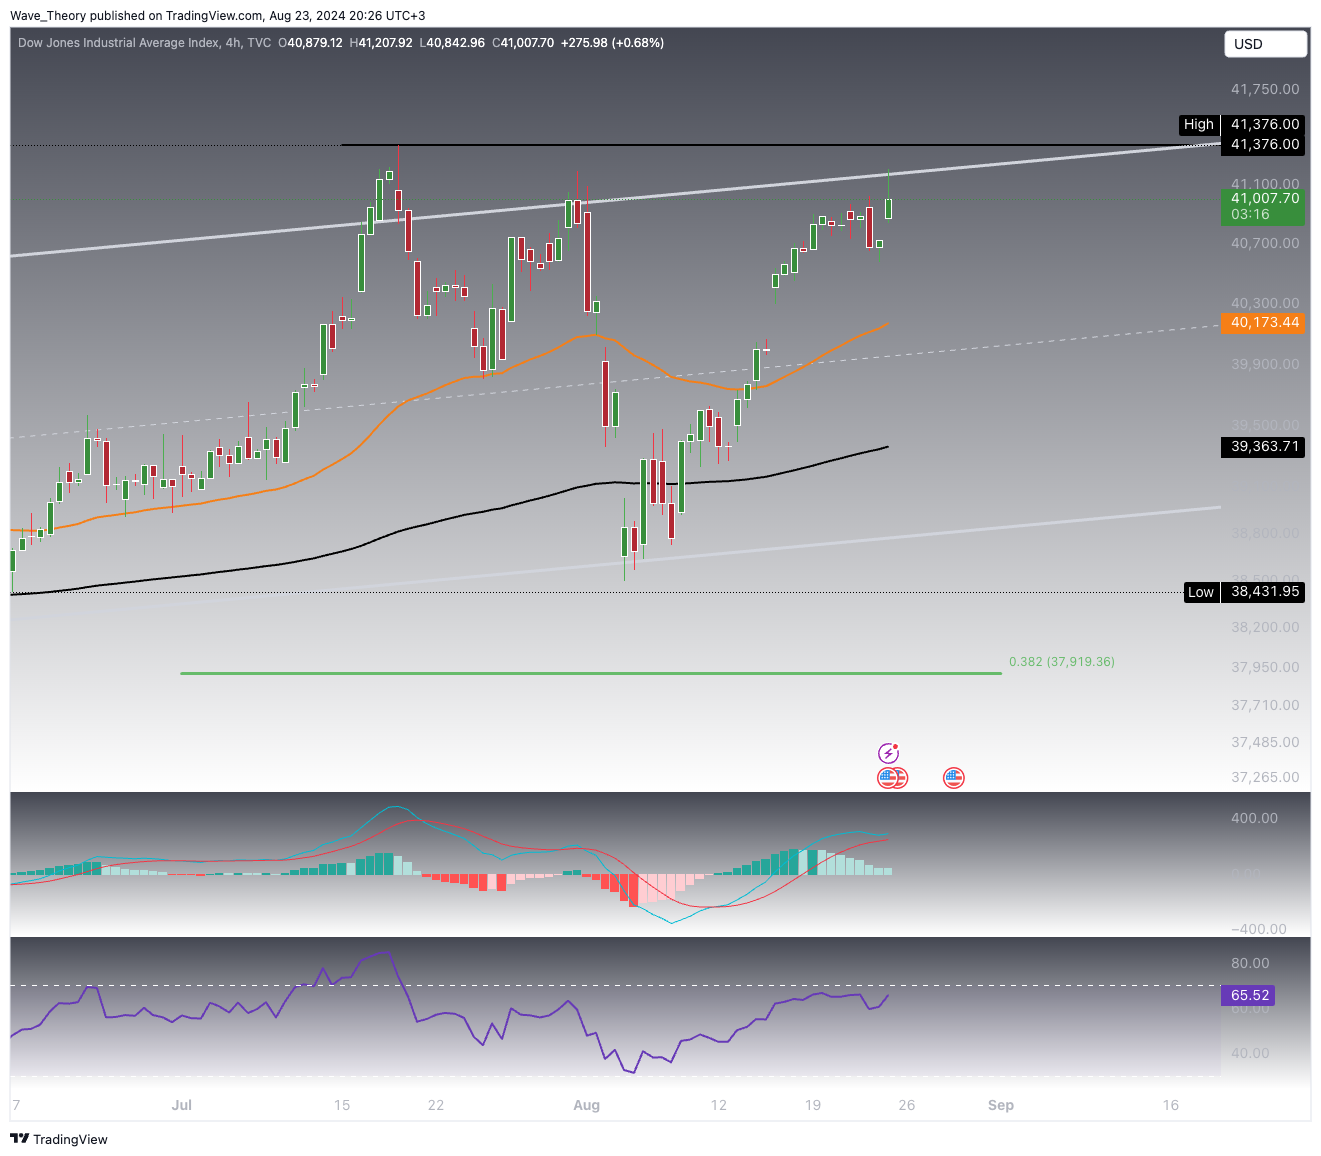
Will Dow Jones Industrial Average (DJI) Renew Bullish Momentum?
The Dow Jones Industrial Average (DJI) is at a critical juncture, with the potential to renew bullish momentum, but the 4H chart presents mixed signals.
Technical Indicators and Trends (4H Chart):
- MACD (Moving Average Convergence Divergence): The MACD shows a potential bearish crossover, as the histogram currently reflects a bearish trend.
- RSI (Relative Strength Index): The RSI is approaching overbought levels but shows no signs of a bearish divergence, indicating continued upward pressure.
- EMA (Exponential Moving Average): The golden crossover of the EMAs reaffirms a short-term bullish trend.
While the overall trend remains positive, the mixed signals from these indicators suggest that traders should exercise caution and closely monitor the DJI for potential shifts in momentum.
The S&P 500 (SPX) and Dow Jones Industrial Average (DJI) have both experienced significant recoveries after recent pullbacks, approaching key resistance levels. The SPX faced rejection at the critical Fibonacci projection level of 5,639 and may find support at 5,443 and 5,320 if it fails to break through. On the weekly chart, DJI is trending within an upward channel and faces resistance near its all-time high of 41,376, with key support levels at 37,919 and 35,500.
Technical indicators across various timeframes present mixed signals for both indices:
- SPX: While the MACD and EMA indicators remain bullish, the RSI is nearing overbought territory, signaling potential caution for traders as a pullback could be on the horizon.
- DJI: The daily chart shows a largely bullish outlook, but the 4H chart presents mixed signals, with the MACD suggesting a potential bearish crossover despite the short-term bullish trend confirmed by the EMAs.
Traders should closely monitor these key levels and indicators as the indices face critical resistance, which could determine the next directional move in the market.
- Check out our free forex signals
- Follow the top economic events on FX Leaders economic calendar
- Trade better, discover more Forex Trading Strategies
- Open a FREE Trading Account