Solana (SOL) Defies Market Trends with Significant Inflows
Solana (SOL) defies market trends with $6.2 million in weekly inflows, while Bitcoin faces substantial outflows. Despite broader market


Solana (SOL) defies market trends with $6.2 million in weekly inflows, while Bitcoin faces substantial outflows. Despite broader market concerns, Solana’s price performance and whale activity signal potential growth, with analysts projecting ambitious price targets amid cautious optimism.
Solana Leads in Weekly Inflows
In a surprising turn of events, Solana (SOL) has attracted $6.2 million in inflows last week, bucking the trend of broader market outflows. This comes at a time when Bitcoin faced substantial outflows of $643 million, highlighting a shift in investor focus towards Solana despite overall market strain.
According to the CoinShares Research Blog, digital asset investment products experienced a total outflow of $726 million last week, matching the highest reported outflows this year seen in March. This bearish sentiment is likely exacerbated by stronger-than-expected macroeconomic data.
Federal Reserve Rate Speculation Heats Up
Market speculation is rampant regarding potential interest rate changes by the U.S. Federal Reserve. There are expectations of a possible 25-basis-point or even a 50-basis-point rate decrease. The upcoming Consumer Price Index (CPI) inflation report is highly anticipated, with the potential for a larger rate drop if inflation data shows a decline.
These macroeconomic discussions have contributed to market anxiety, affecting popular cryptocurrencies including Bitcoin, Ethereum, XRP, and Solana, which saw value drops over the recent weekend.
Solana Price Performance and Whale Activity
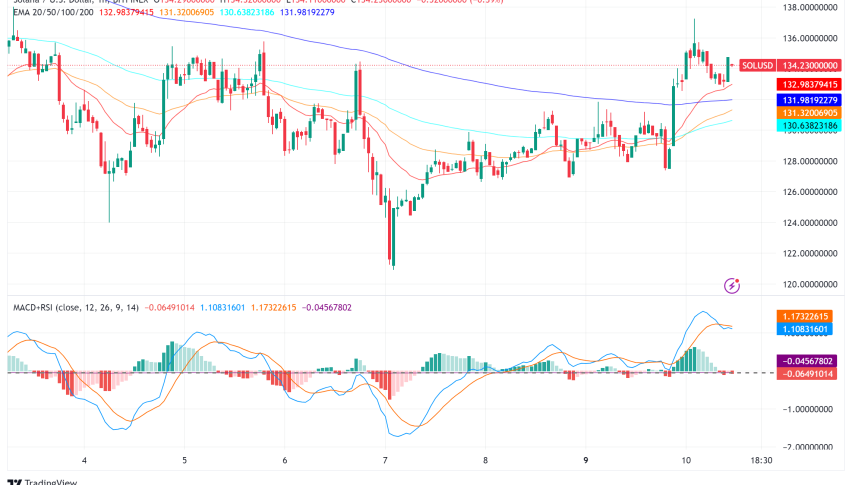
Despite a challenging start to September for the crypto market, recent days have shown signs of recovery. Solana’s price is up 4.4%, trading around $134. A recent LookOnChain report indicates positive whale activity, with one whale purchasing 34,807 SOL ($4.52M) in the last 12 hours. Since February 7, this whale has withdrawn and staked significant amounts of SOL, potentially signaling bullish sentiment.
SOL/USD Technical Analysis: Solana at a Crucial Juncture
Solana’s price action shows a critical support level at $120, which has been tested multiple times throughout 2023 and 2024. Currently trading at $134.53, SOL has bounced off this support, indicating potential for upward movement. Key resistance levels lie at $135 and $138, with a break above potentially leading to a rally towards $150-$175.
The hourly chart reveals a bullish trend line with support at $130. Technical indicators offer mixed signals: the MACD hints at possible positive momentum, the RSI is above 50, and the price is trading above the 100-hourly simple moving average. However, recent lower highs around $135 and $145 suggest buyers are still struggling for dominance.
A surge in trading volume (up 63.72%) and open interest (up 1.22% to $2.04 billion) indicates renewed market interest. For a confirmed bullish trend, SOL needs to break above $145-$150. Conversely, a fall below $120 could trigger further decline. Traders should monitor these levels closely as they may signal Solana’s short to medium-term direction.
- Check out our free forex signals
- Follow the top economic events on FX Leaders economic calendar
- Trade better, discover more Forex Trading Strategies
- Open a FREE Trading Account


