XRP Poised for Potential Breakout as Ripple Prepares Stablecoin Launch
XRP continues to make headlines with recent market analyses suggesting a potential breakout and the imminent launch of Ripple's stablecoin.


XRP continues to make headlines with recent market analyses suggesting a potential breakout and the imminent launch of Ripple’s stablecoin. Here’s a comprehensive look at the latest developments surrounding XRP.
XRP/USD Technical Analysis Hints at Possible Price Squeeze
Crypto analyst MichaelXBT has identified patterns in the XRP/BTC chart that suggest a major price movement may be on the horizon. The 4-hour timeframe reveals a series of descending and symmetrical triangles forming since mid-July, indicating a compression of price action into a narrow range.
MichaelXBT points to converging trend lines and wedge formations as evidence of building pressure. The analyst believes these patterns signal an impending “squeeze” that could lead to a significant price movement once key levels are breached.
While specific price targets weren’t provided, MichaelXBT has previously expressed a bullish outlook on XRP, with a primary target around $2. The analyst also highlighted the importance of the $0.62 level, which he considers a critical resistance zone that, when broken, could trigger a rally.
Ripple Stablecoin Launch Imminent
In a development that could significantly impact XRP’s ecosystem, Ripple CEO Brad Garlinghouse announced at Korea Blockchain Week that the company’s stablecoin, Ripple USD (RLUSD), is set to launch within weeks.
Crypto analyst @Sentosumosaba suggests that the RLUSD launch could benefit XRP, as increased activity on the XRP Ledger would drive demand for XRP as a gas token. This could potentially lead to price appreciation for XRP.
Ripple CTO David Schwartz clarified that RLUSD will be available exclusively to institutions, comparing it to established stablecoins like USDC and USDT.
Current Market Status
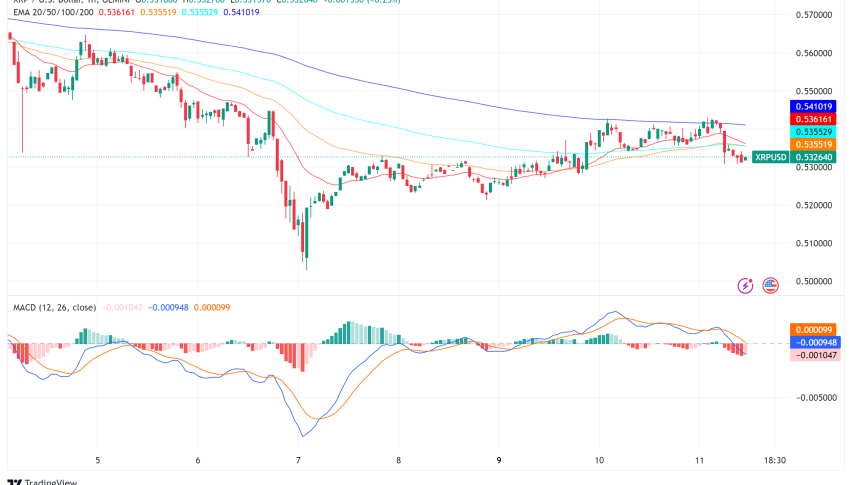
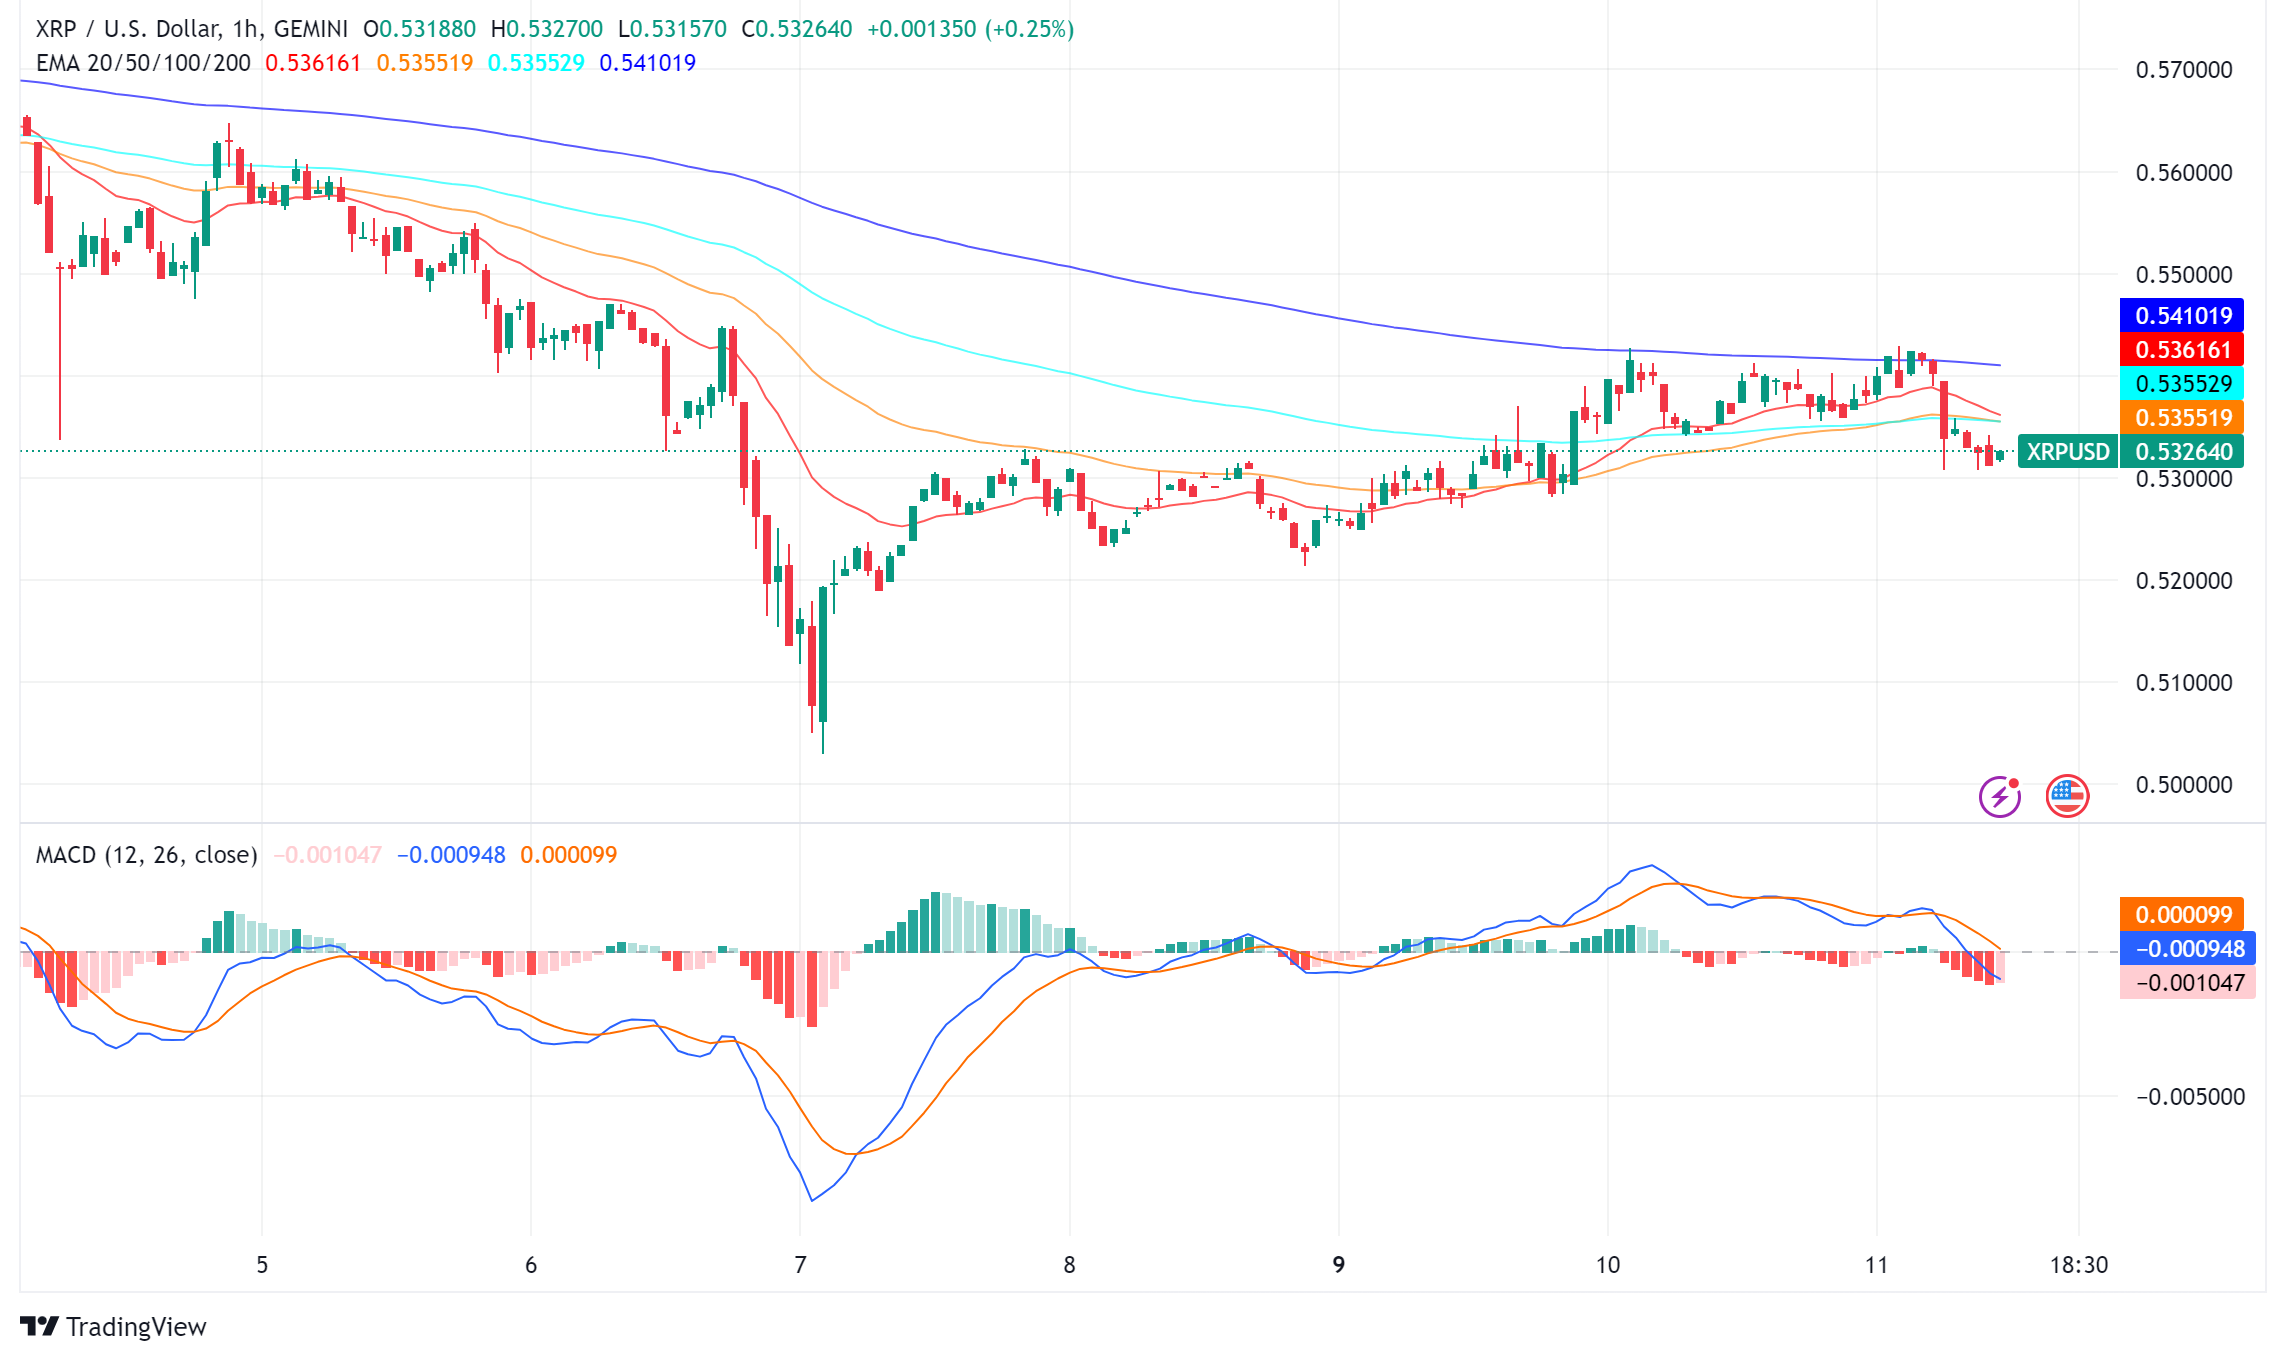
As of the latest data, XRP is trading at $0.53, showing a down by around 0.7% over the past 24 hours. Against Bitcoin, XRP is trading at 0.00000944 BTC, marking a 25% increase from its July 5 low.
The altcoin is currently in a slight downward trend, with potential support at the September 6 low of $0.5026. Technical indicators, including the Moving Average Convergence Divergence (MACD), suggest underlying negative momentum.
However, a daily close above the psychological level of $0.6000 could invalidate the bearish outlook, potentially setting the stage for a move towards the $0.6217 level.
- Check out our free forex signals
- Follow the top economic events on FX Leaders economic calendar
- Trade better, discover more Forex Trading Strategies
- Open a FREE Trading Account


