Forex Signals Brief October 1: Is a Softer Eurozone CPI Priced In?
Today the Eurozone CPI inflation is expected to slow further but it might be priced in after the soft inflation from European countries.

Yesterday started with a round of economic data from China, most of which showed further economic slowdown, such as the Caixin services and manufacturing PMI figures. That didn’t deter risk asset buyers as the Chinese stimulus kept driving markets. EUR/USD retested 1.12 again despite softer German and Italian CPI inflation numbers for September, which indicate lower Eurozone inflation later today. But buyers couldn’t hold the price above 1.12 and eventually this pair fell 1 cent lower during the US session.
Atlanta Fed President Bostic and Chicago Fed President Goolsbee kicked off the discussion with their respective insights on monetary policy. However, it was Fed Chair Jerome Powell who grabbed attention as he sought to retract expectations for a 50 basis point rate cut in November during a speech at a National Association of Business Economists (NABE) event.
- Labor Market and Economic Health: Powell highlighted that the labor market remains robust and the broader economy is still on solid footing.
- Disinflation Outlook: He voiced increased confidence that inflation is on a downward path, progressing toward the Fed’s 2% target.
- Rate Cuts Strategy: Powell emphasized that any future rate cuts will be gradual and driven by incoming economic data. He left room for two potential rate cuts by the end of the year, but reiterated caution.
- Market Response: The market adjusted its outlook, scaling back expectations for a 50 basis point rate cut in November. The probability of such a cut fell from around 60% last week to just 35%, as investors digested Powell’s more measured tone.
Today’s Market Expectations
Today’s key event is the release of the Eurozone’s September CPI. Before the report, market consensus expected headline year-on-year CPI to fall from 2.2% to 2.0%, core CPI to ease from 2.8% to 2.7%, and the super-core to remain steady at 2.8%. If headline inflation hits the 2.0% mark, it will be the first time since June 2021 that it’s reached the European Central Bank’s target. In the August report, headline inflation had fallen from 2.6% to 2.2%, largely due to lower energy costs, while core inflation showed only a slight decrease, driven by goods inflation. Meanwhile, services inflation edged up to 4.2% from 4.0%, partly due to the boost from the French Olympics. Regional inflation data from France, Germany, Italy, and Spain came in lower than expected ahead of today’s release.
On the US side, job openings data is expected, with consensus forecasting 7.670M openings, down slightly from 7.673M. In the previous report, a sharp drop in openings surprised the market, though the hiring rate saw a modest increase, and the layoff rate remained low. This indicates a labor market where job loss risk is minimal, but finding new employment remains challenging. The coming months will provide a clearer picture as we gauge the impact of recent economic developments.
Additionally, the US ISM Manufacturing PMI is expected to show a slight improvement, rising to 47.5 from 47.2 in the previous month. Alongside the upcoming Non-Farm Payroll (NFP) report, the ISM PMI will be one of this week’s most crucial US economic releases. Last week’s S&P Global PMIs showed continued weakness in manufacturing. While these PMIs, and possibly the ISM numbers, may not fully reflect the recent Federal Reserve decision, the fact that ISM data is collected in the final week of each month could mean we see some improvement compared to the S&P Global report.
Yesterday the number of trading signals was lower, with only two closed trades, both of which were winning forex signals though. Our other trades in GOLD and EUR/GBP were going in the right direction, but they missed the take profit target narrowly, extending into today.
Gold Closed Down on Friday After Another Great Week
Renewed buyer interest suggests that Ethereum could be poised for further gains. Meanwhile, we opted to open a buy trade in XAU/USD (gold) despite the fact that gold has dropped over $50 from its highs, which had surged following dovish comments by Federal Reserve Chair Jerome Powell. The overall trend for gold remains bullish, and the metal appears to be forming a bullish reversal pattern. Moving averages are helping maintain the upward momentum by providing support during pullbacks. Currently, gold is down 1%, dropping $30 to $2,628.85, though the 200-day SMA continues to act as a key support level.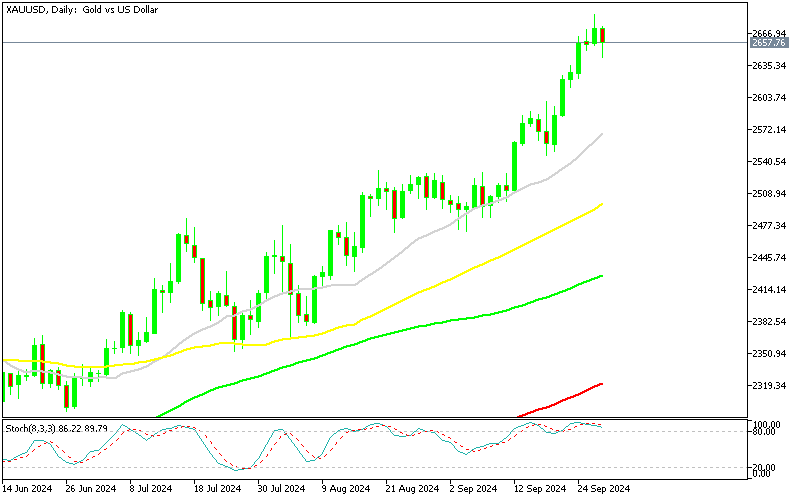
XAU/USD – Daily chart
EUR/GBP Continues the Downtrend
In the currency markets, the EUR/GBP continues to make lower lows, reaching its lowest level in over two years. Sellers remain in control, as weak Eurozone inflation data, following softer CPI reports from major European economies, has led the European Central Bank (ECB) to adopt a more dovish stance. This is reflected in comments by ECB President Christine Lagarde, which have contributed to the Euro’s decline. The recent drop in EUR/GBP to 0.83 is largely due to policy divergence between the ECB and the Bank of England (BOE). While the ECB has cut rates twice by 25 basis points each, signaling a monetary easing cycle, the BOE abruptly halted its rate cuts after a single 25 basis point reduction. This divergence has played a significant role in the bearish trend seen in the EUR/GBP pair.
UR/GBP – Weekly Chart
Cryptocurrency Update
Bitcoin Retreats Below $65,000, Respecting the Descending Channel

BTC/USD – Daily chart
Ethereum Holds Above $2,500
Ethereum has followed a similar downward trajectory, declining steadily since March. By June, its value had fallen from $3,830 to below $3,000. Continued selling pressure saw the price dip to as low as $2,200 before bouncing back briefly above the 50-day SMA. The 100-week SMA is currently providing solid support, with recent bullish candlestick formations indicating a potential reversal of Ethereum’s bearish trend.
ETH/USD – Weekly chart
- Check out our free forex signals
- Follow the top economic events on FX Leaders economic calendar
- Trade better, discover more Forex Trading Strategies
- Open a FREE Trading Account
- Read our latest reviews on: Avatrade, Exness, HFM and XM
Related Articles

Sidebar rates
Related Posts
