USDCAD Surges Above September’s High as Oil Prices Fall $5
USDCAD has started the week on a strong bullish foot, having risen 130 pips already in the first two days, as risk assets tumble lower.
USDCAD has started the week on a strong bullish foot, having risen 130 pips already in the first two days, as risk assets tumble lower. yesterday crude Oil surged $2.5 higher but the CAD didn’t benefit much, while today Oil prices have declined by around $5 so far, which is adding further pressure to the CAD, sending USD/CAD above the swing high level from September.
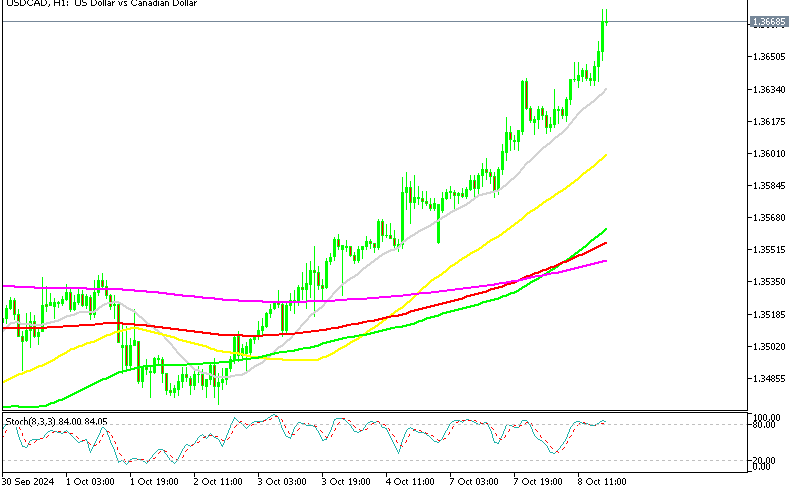
USD/CAD Chart H1 – The Surge in the Last Two Weeks Has Been Relentless
In late September, USD/CAD turned bullish, with buyers pushing the price past 1.36, now reaching 1.3675, despite recent rises in crude oil prices that lifted WTI above $78. A dovish shift from the Bank of Canada (BoC) on weakening economic data and declining inflation has spurred USD/CAD interest, with today’s $5 drop in oil prices removing the CAD’s last support. As fundamentals lean negative for CAD, USD/CAD has been further bolstered by a strong U.S. labor market, evidenced by last week’s employment report. This has diminished expectations for a 50 basis point rate cut by the Fed in November.
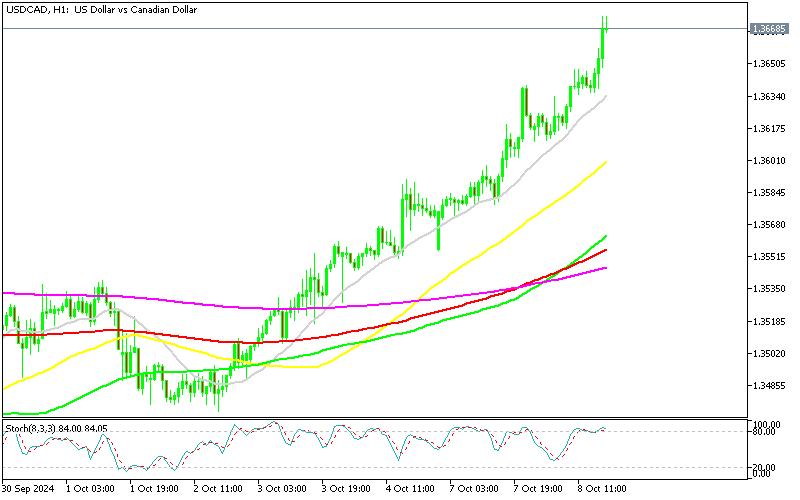
Since breaking September highs, USD/CAD’s chart has taken on new significance. After initially stumbling following the Fed’s recent 50 basis point cut, the U.S. economy has shown resilience. Market expectations now place the Fed funds rate bottom at 3.25%-3.50%, rather than 2.75%. Meanwhile, Canadian economic indicators continue to weaken, with the BoC signaling potential openness to a larger 50 basis point rate cut in October.
In summary, economic data is highlighting a divergence between the U.S. and Canadian economies. The widening rate differentials between the two nations have strengthened USD/CAD, with the pair gaining roughly 2 cents in October, reflecting the U.S. dollar’s strengthening.
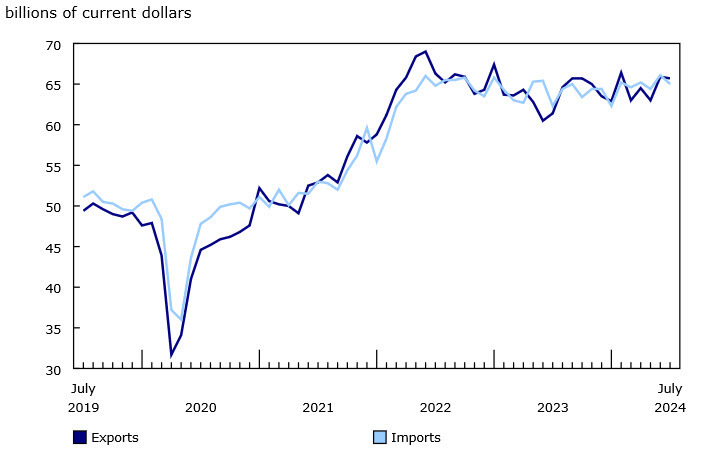
Canada August Trade Balance Data
USD/CAD Live Chart
- Check out our free forex signals
- Follow the top economic events on FX Leaders economic calendar
- Trade better, discover more Forex Trading Strategies
- Open a FREE Trading Account
- Read our latest reviews on: Avatrade, Exness, HFM and XM
Related Articles


Sidebar rates
Related Posts
