Dogecoin Surges 25% in a Week: Technical Analysis Points to Potential New Yearly Highs
Dogecoin (DOGE) has experienced a remarkable surge, jumping over 25% in recent trading sessions, with the leading meme cryptocurrency now


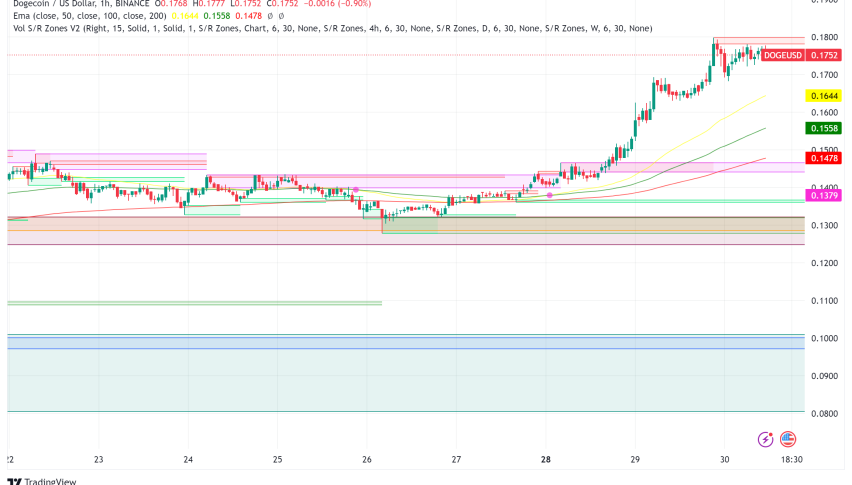
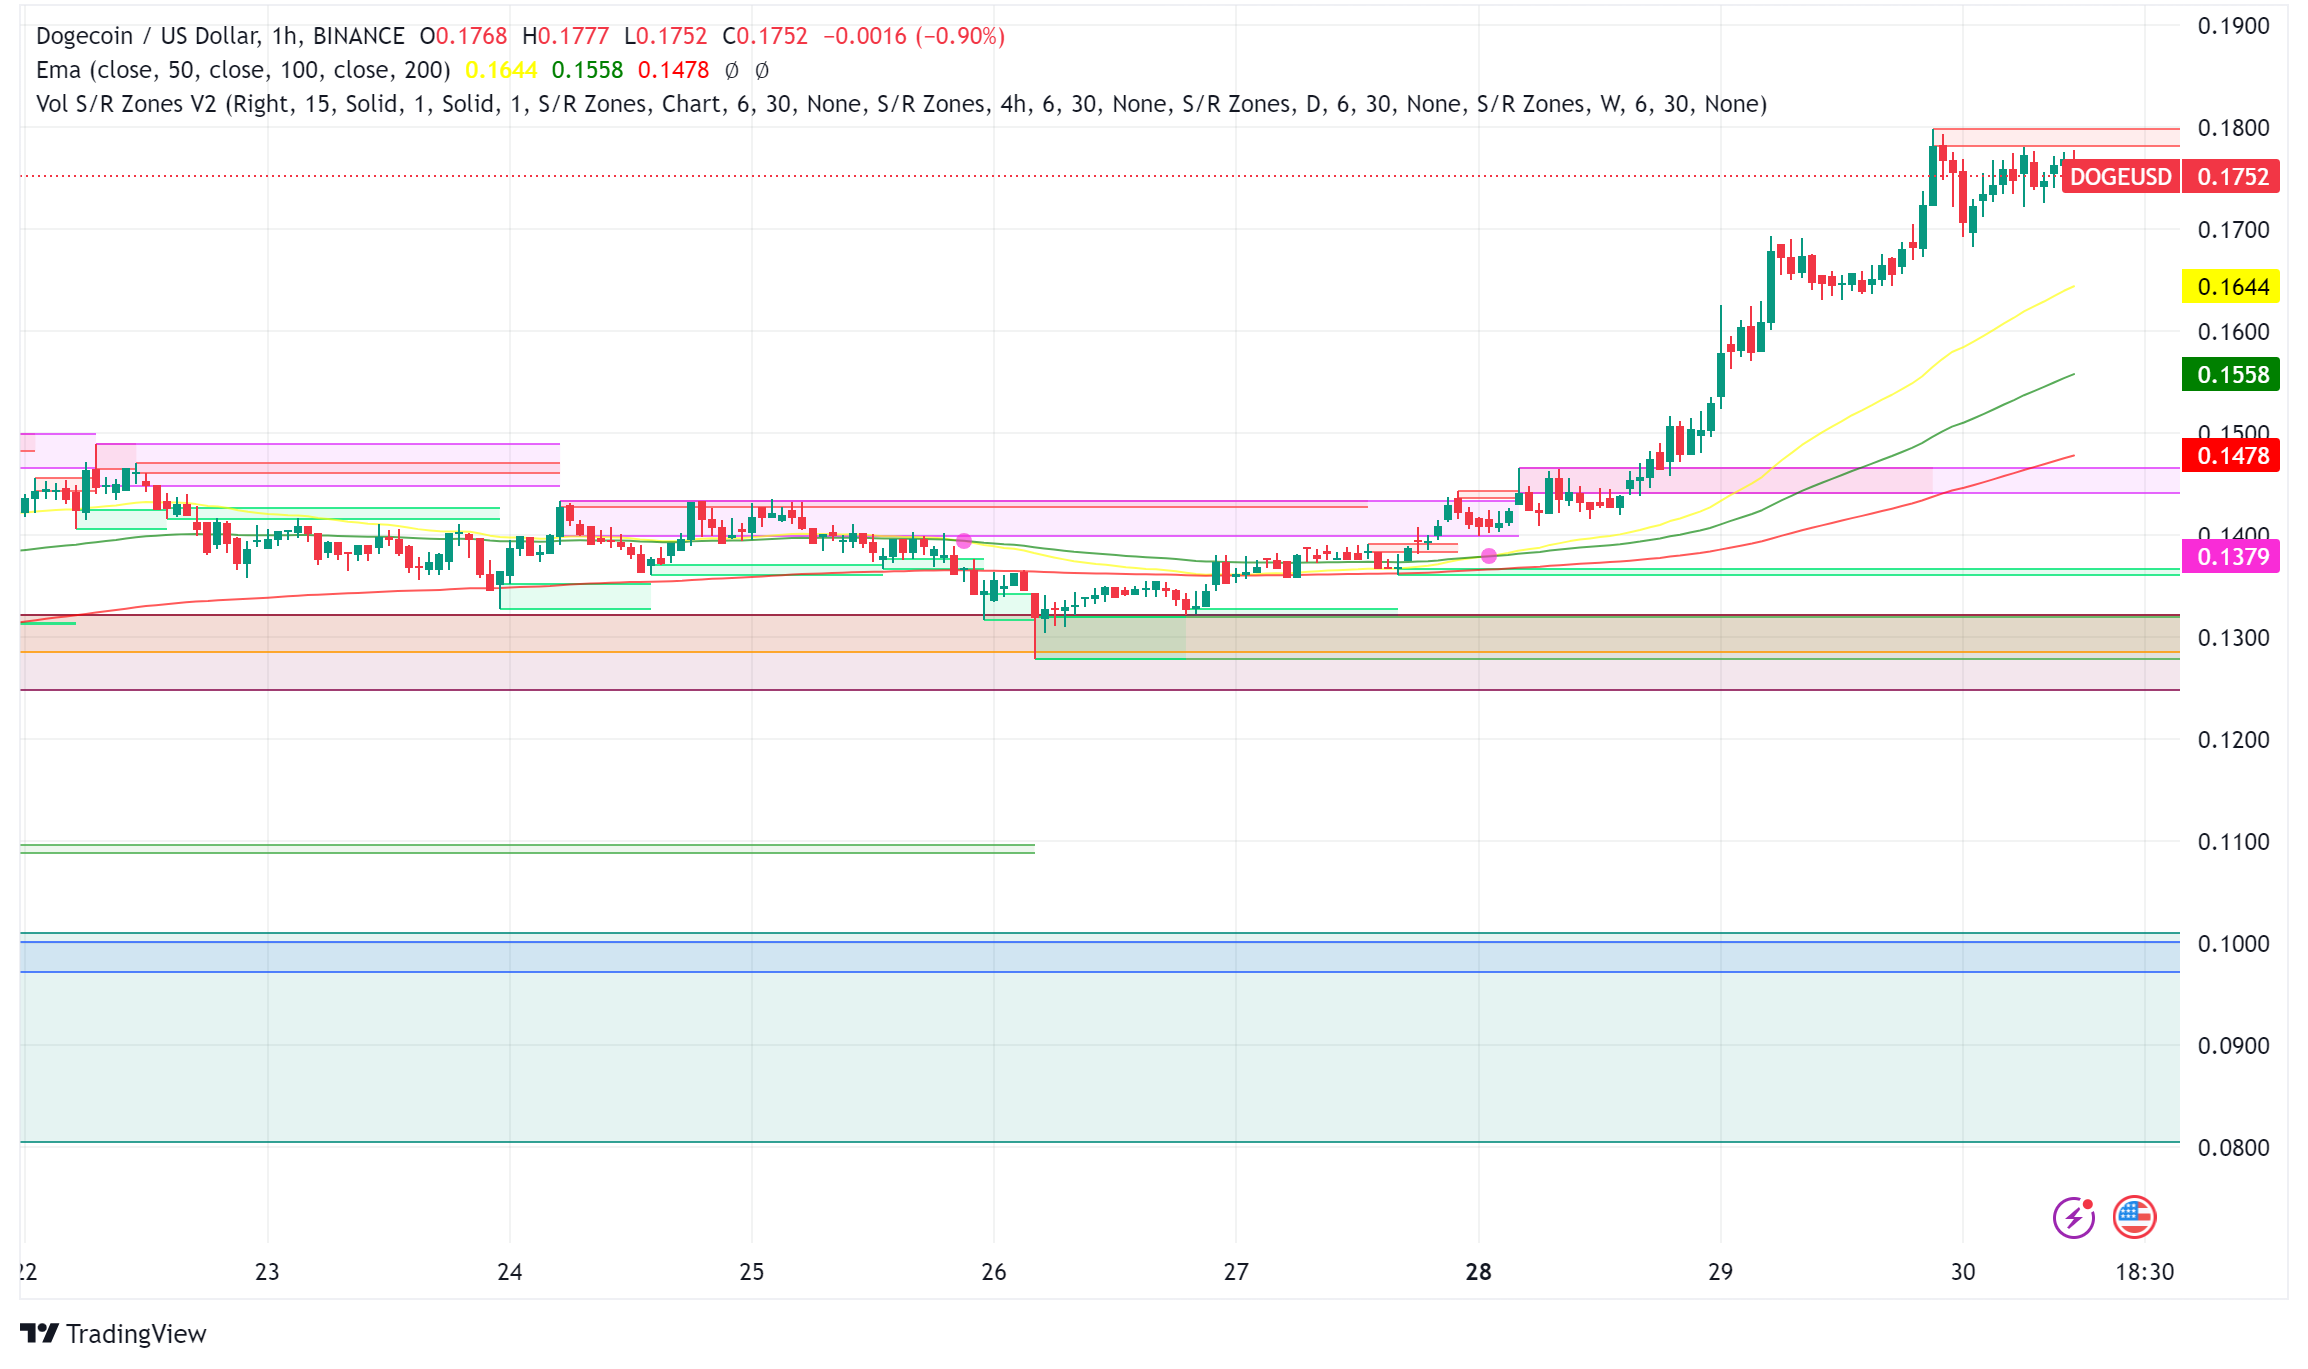
Dogecoin (DOGE) has experienced a remarkable surge, jumping over 25% in recent trading sessions, with the leading meme cryptocurrency now trading at $0.175. Technical analysis and market indicators suggest potential for further upside, though some metrics warn of possible correction ahead.
Recent Price Action and Technical Outlook
The cryptocurrency has posted impressive gains, rising nearly 33% since bouncing off its 100-day Simple Moving Average on Saturday. DOGE is currently attempting to establish support above the crucial $0.1756 level, which could pave the way for a test of its yearly high at $0.2288.
“The bulls were able to pump the price above the $0.1650 resistance, forming a high at $0.1796,” notes technical analysis from recent market data. A key bullish trend line has formed with support at $0.1715 on the hourly chart, suggesting strong buyer interest at current levels.
DOGE/USD Technical Indicators Paint Mixed Picture
Multiple technical indicators are providing conflicting signals:
- The MACD (Moving Average Convergence Divergence) is gaining momentum in the bullish zone
- RSI (Relative Strength Index) remains above the 50 level, indicating sustained buying pressure
- However, the RSI has entered overbought territory, suggesting potential for a price correction
Dogecoin’s On-Chain Metrics Signal Caution
IntoTheBlock’s data reveals that over 92% of the total DOGE supply is currently in profit, a situation that historically precedes profit-taking activities. The Market Value to Realized Value (MVRV) Ratio has reached a five-month high of 77%, indicating that holders are, on average, 81% up on their initial investments.
Dogecoin Price Prediction
Former Goldman Sachs top manager and crypto analyst Raoul Pal has identified what appears to be a bull flag pattern that began in 2021. Pal suggests DOGE is approaching what he terms the “banana zone,” potentially signaling a period of unrestrained upward price movement.
Key Levels to Watch
Support levels:
- $0.1715 (immediate support)
- $0.1675 (secondary support)
- $0.1630 (major support)
Resistance levels:
- $0.1780 (immediate resistance)
- $0.1800 (psychological resistance)
- $0.2288 (yearly high)
Political Catalysts
Recent political developments, including Elon Musk’s involvement in government efficiency initiatives and his appearance at political rallies, have added another dimension to DOGE’s market dynamics. The proposed Department of Government Efficiency (DOGE) initiative has sparked renewed interest in the cryptocurrency.
- Check out our free forex signals
- Follow the top economic events on FX Leaders economic calendar
- Trade better, discover more Forex Trading Strategies
- Open a FREE Trading Account


