HBAR Surges Over 40%: $222M Open Interest Reflects Bullish Momentum
Hedera (HBAR) has taken the crypto market by storm, surging over 40% within 24 hours and crossing the $0.25 mark for the first time...

Hedera (HBAR) has taken the crypto market by storm, surging over 40% within 24 hours and crossing the $0.25 mark for the first time in two years.

Currently trading at $0.25226, this dramatic rally highlights growing investor confidence, fueled by market-wide bullish sentiment and Hedera’s strong fundamentals. The recent price spike aligns with the broader market trend, as major altcoins like XRP and Ethereum also enjoy gains.
Rumors of Hedera’s potential collaboration with Ripple and its expanding partnerships have amplified social sentiment. Institutional investors are eyeing HBAR due to its enterprise-grade solutions, offering low transaction fees, high scalability, and a thriving decentralized finance (DeFi) ecosystem.
Record-Breaking Open Interest Signals Strong Market Sentiment
HBAR’s open interest has skyrocketed to $222 million, marking a staggering 1,000% increase in just 30 days. This unprecedented growth indicates heightened trader activity, as market participants position themselves for sustained price gains. Derivatives trading volumes underscore strong trust in HBAR’s bullish trajectory, with traders betting on its potential to surpass key resistance levels.
The surge in open interest reflects the market’s optimism, reinforced by HBAR’s ability to deliver real-world utility. As DeFi gains momentum, Hedera’s unique value proposition continues to attract a diverse investor base.
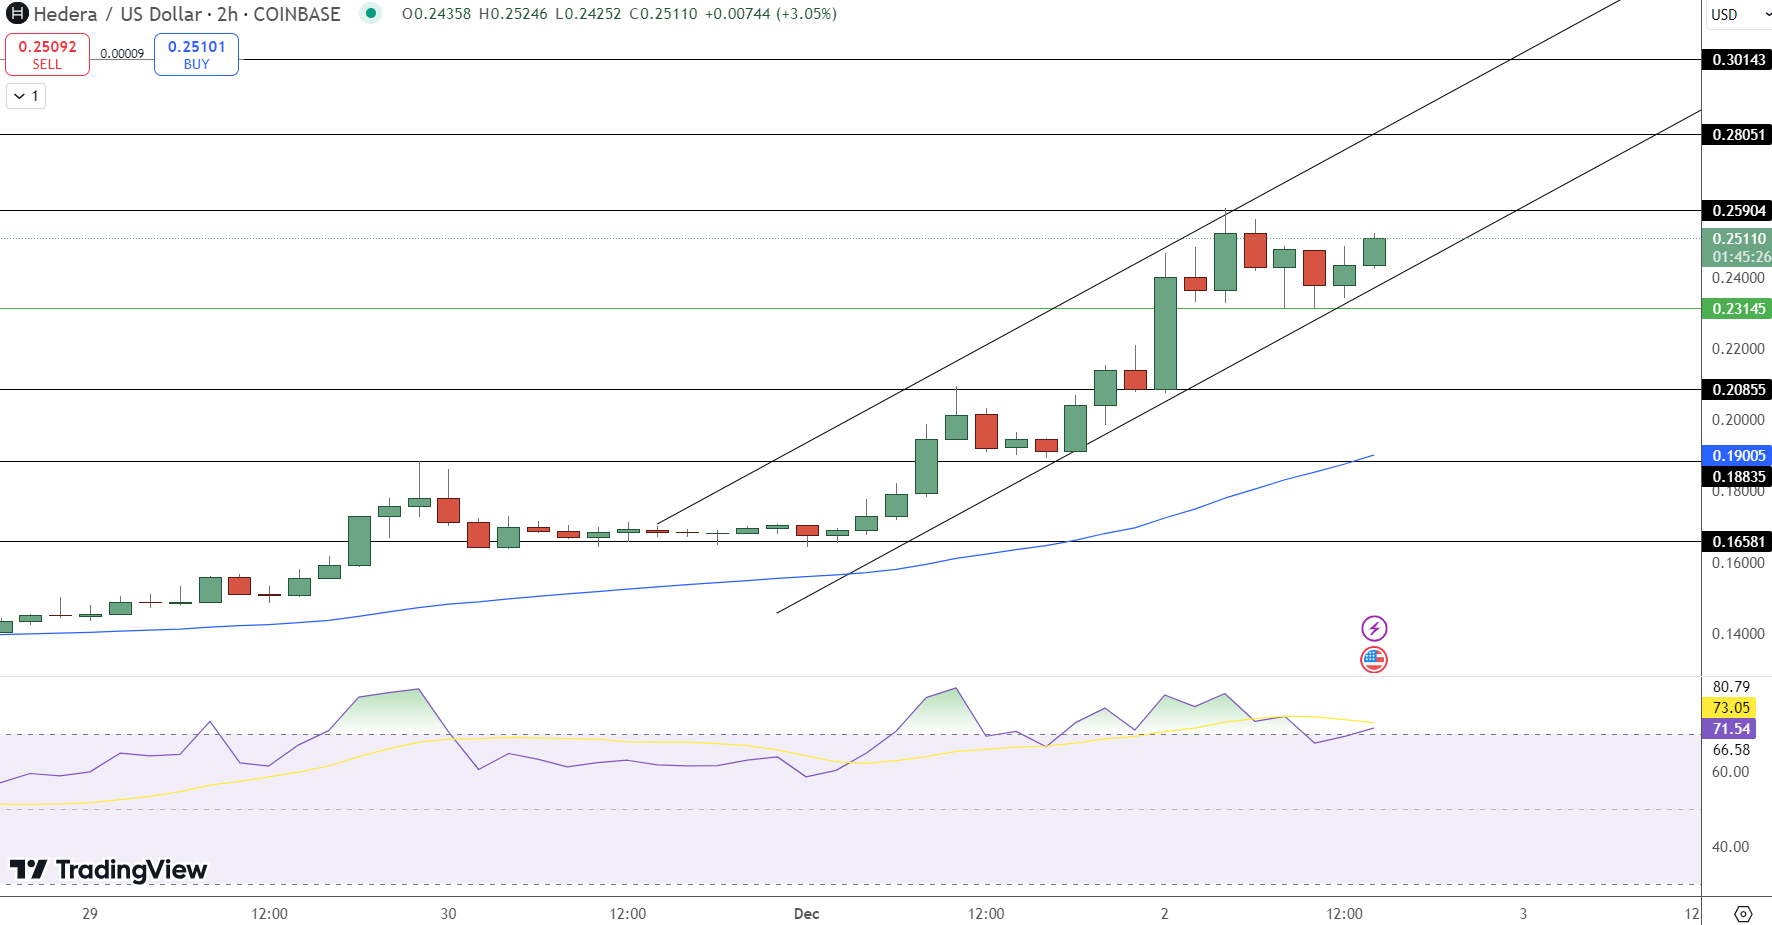
Daily Technical Outlook: Hedera (HBAR/USD) – December 2, 2024
HBAR is currently trading at $0.25226, up 3.53%, sustaining its bullish momentum within an ascending channel. The price has broken above the pivot point at $0.23145, signaling strong buying interest. Immediate resistance lies at $0.25904, with further targets at $0.28051 and $0.30143. On the downside, support is visible at $0.23145, followed by $0.20855 and $0.19010.
Key technical indicators suggest a continuation of the bullish trend:
-
Relative Strength Index (RSI): Currently at 73.07, indicating overbought conditions but with room for further gains.
-
50-Day EMA: At $0.19010, providing strong support and reinforcing the broader uptrend.
A continuation above $0.25904 could lead to gains toward $0.28051, while a break below $0.23145 may prompt a short-term pullback. Traders should monitor resistance levels closely for potential breakout opportunities.
Key Insights:
-
Resistance Levels: $0.25904, $0.28051, $0.30143.
-
Support Levels: $0.23145, $0.20855, $0.19010.
-
Momentum: RSI at 73.07 suggests bullish sentiment, but overbought signals warrant caution.
- Check out our free forex signals
- Follow the top economic events on FX Leaders economic calendar
- Trade better, discover more Forex Trading Strategies
- Open a FREE Trading Account
- Read our latest reviews on: Avatrade, Exness, HFM and XM
Related Articles


Sidebar rates
Related Posts
