Bitcoin Shows Exhaustion, Short Sellers Target $85K
Price patterns highlighted the most sought after digital asset faces market correction

Bitcoin hit a new all-time high (ATH) of $104,088 this month then dropped precipitously to a daily low of $90,500, bounced back, and closed the day above $98K. Price patterns highlighted the most sought-after digital asset faces market correction.

Bitcoin’s Relative Strength Index (RSI) shows warning signs even though it recovered from Thursday’s decline and rose until Sunday. As of Monday morning, BTC is trading marginally lower at $98,900.
The RSI chart suggested the formation of a bearish divergence, which frequently results in a short-term correction.
Traders anticipate a steep decline toward the $90,000 support level and a slight increase toward the most recent high of $104,088 if this bearish divergence persists (grabbing liquidity or trapping longs). If this level is successfully closed below, the market may continue to decline until it reaches the next support level of $85K.
However, if Bitcoin closes above $104,088, its upward trend may continue, and it may continue to rise toward the new all-time high of $119,510.
Santiment data paints a neutral picture given that Bitcoin’s total mining balances have been declining since April 2024, the statistics present a neutral picture. Nonetheless, this most recent decline of 85,503 BTC in a single day is the most severe since late February, two weeks before the all-time high of $73K.
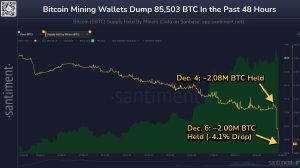
These wallets have not been in line with prices for most of the year. The number of non-mining sharks and whales continues to rise. For now, think of this as a net-neutral signal.
- Check out our free forex signals
- Follow the top economic events on FX Leaders economic calendar
- Trade better, discover more Forex Trading Strategies
- Open a FREE Trading Account
- Read our latest reviews on: Avatrade, Exness, HFM and XM
Related Articles


Sidebar rates
Related Posts
