Gold Price at $2,715: Bullish Momentum Faces Key Resistance Levels
Gold prices dipped slightly on Thursday, slipping to $2,715 as investors booked profits following a strong rally earlier this week.

Gold prices dipped slightly on Thursday, slipping to $2,715 as investors booked profits following a strong rally earlier this week.

This pullback comes after gold scaled a one-month high, buoyed by growing confidence in a Federal Reserve rate cut on December 18. The CME FedWatch Tool indicates a 98.5% probability of a 25-basis-point cut, up from 86% before November’s inflation report, which met market expectations.
Ajay Kedia, director at Kedia Commodities, attributed the decline to short-term profit-taking. “Geopolitical tensions, China’s renewed gold purchases, and steady inflation figures have been supportive for gold this week. However, investors are locking in gains ahead of major central bank events,” he said.
The U.S. Producer Price Index (PPI) data due later today will provide further clues on the Federal Reserve’s policy direction for 2025. Meanwhile, the European Central Bank is expected to announce another rate cut, signaling more easing in the coming year. Lower interest rates typically favor zero-yield assets like gold, strengthening their appeal during economic and geopolitical uncertainty.
Geopolitical and Economic Tailwinds for Gold
Gold’s resilience has also been fueled by geopolitical developments. The United Nations General Assembly voted overwhelmingly on Wednesday to demand a ceasefire in the Israel-Hamas conflict, adding to the global uncertainty that has historically driven demand for safe-haven assets. Additionally, China’s recent purchases of gold reserves signal a strategic move, reinforcing bullish sentiment in the market.
With cooling U.S. labor market data and inflation within expectations, the Fed is unlikely to waver on its rate cut trajectory. Similarly, the ECB’s easing stance provides further support for gold prices as central banks prioritize growth over inflation control.
Technical Outlook: Key Resistance and Support Levels
Gold remains in a bullish zone, trading at $2,715 after breaking a symmetrical triangle pattern on the 2-hour chart. Immediate resistance levels are seen at $2,727 and $2,750, with a potential surge to $2,775 if momentum continues. On the downside, critical support levels are identified at $2,700 and $2,683 (50-day EMA).
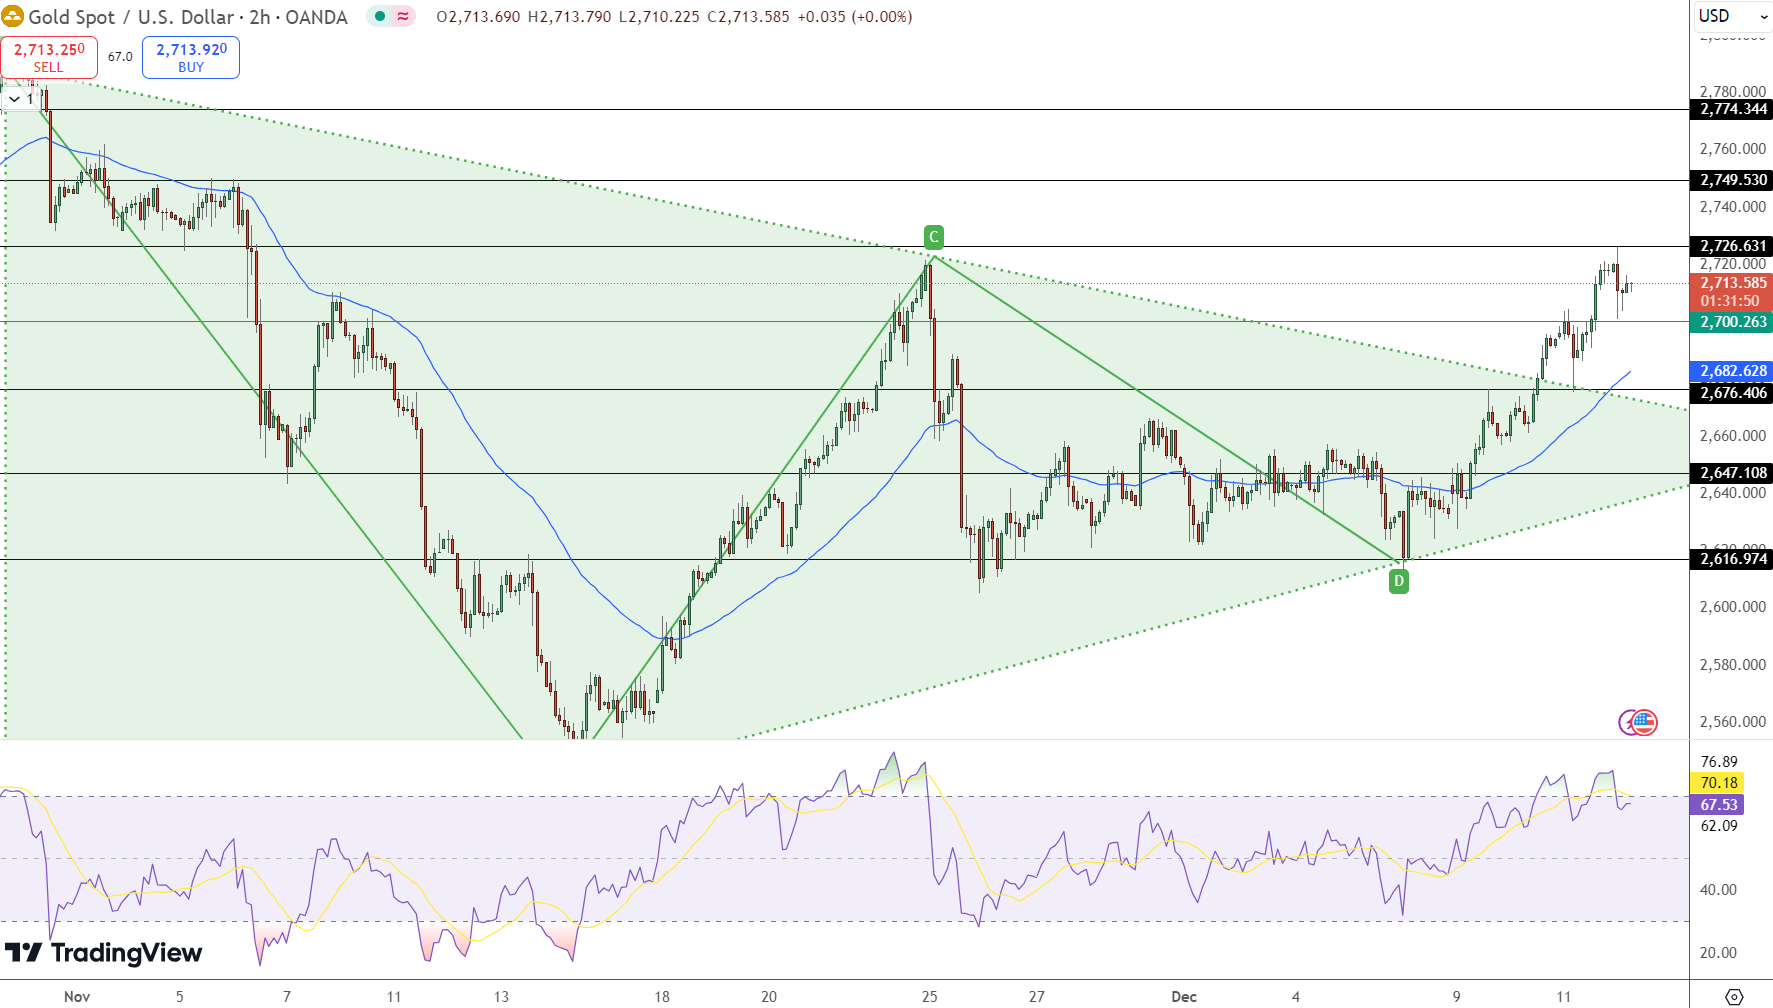
- Resistance Levels: $2,727, $2,750, $2,775
- Support Levels: $2,700, $2,683 (50 EMA), $2,647
- RSI: 70.18, signaling overbought but strong upward momentum
Gold’s outlook remains positive, with broader macroeconomic conditions aligning to support further gains in the coming sessions.
- Check out our free forex signals
- Follow the top economic events on FX Leaders economic calendar
- Trade better, discover more Forex Trading Strategies
- Open a FREE Trading Account
- Read our latest reviews on: Avatrade, Exness, HFM and XM
Related Articles


Sidebar rates
Related Posts
