Despite the potential for a short-term correction, the overall trend for Coinbase (COIN) remains bullishly confirmed, as the EMAs on the daily chart continue to show a golden crossover.
Is The Coinbase (COIN) Stock Positioned for a New All-Time High?
•
Last updated: Wednesday, December 18, 2024

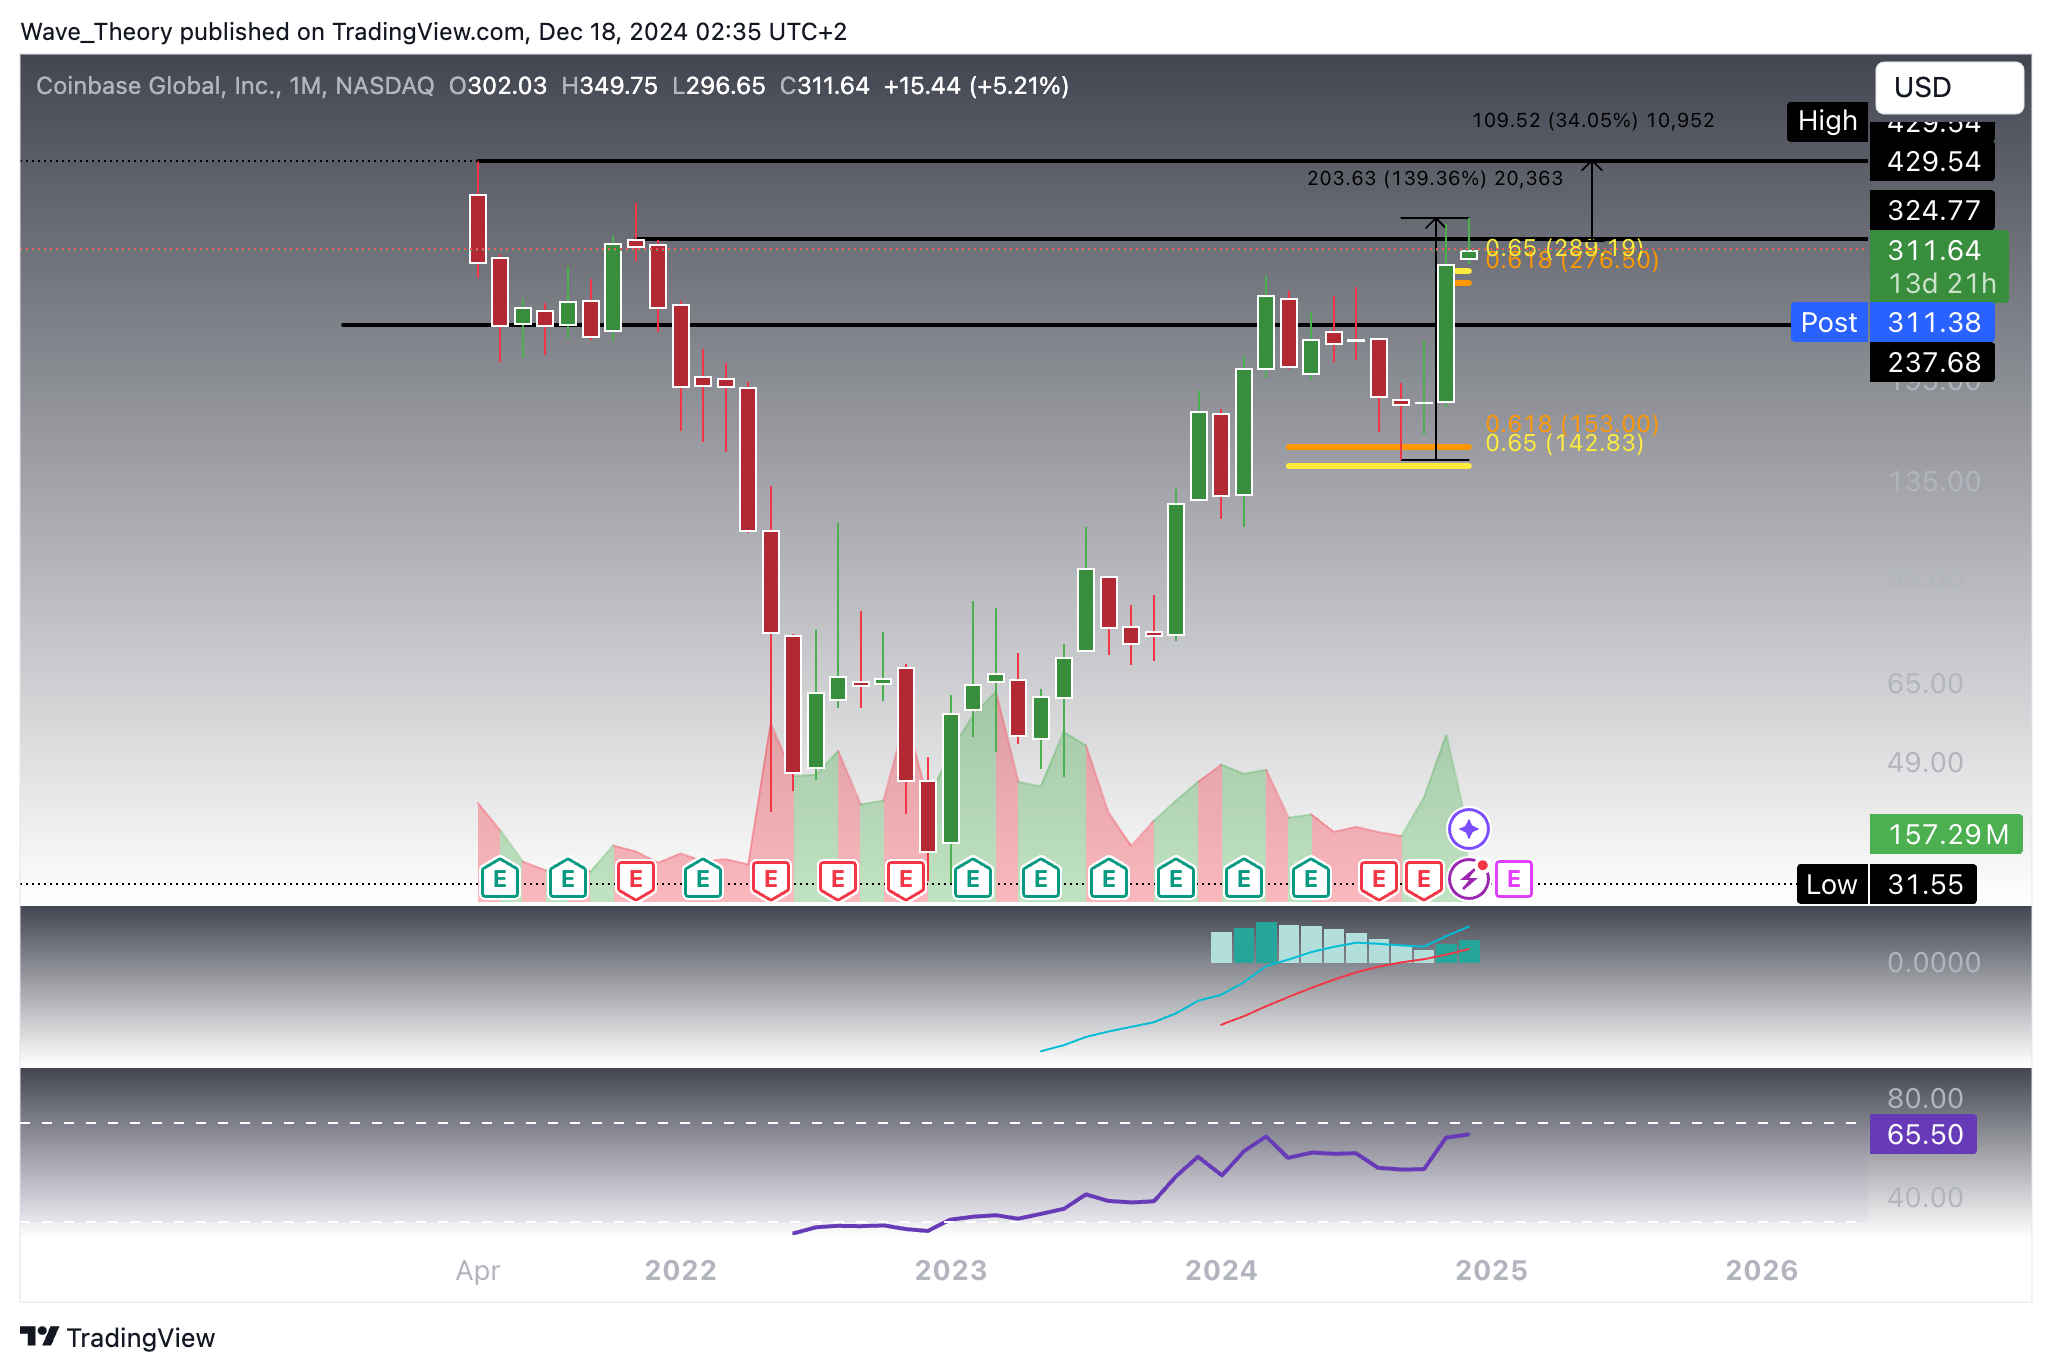
Coinbase Stock Now Faces Resistance
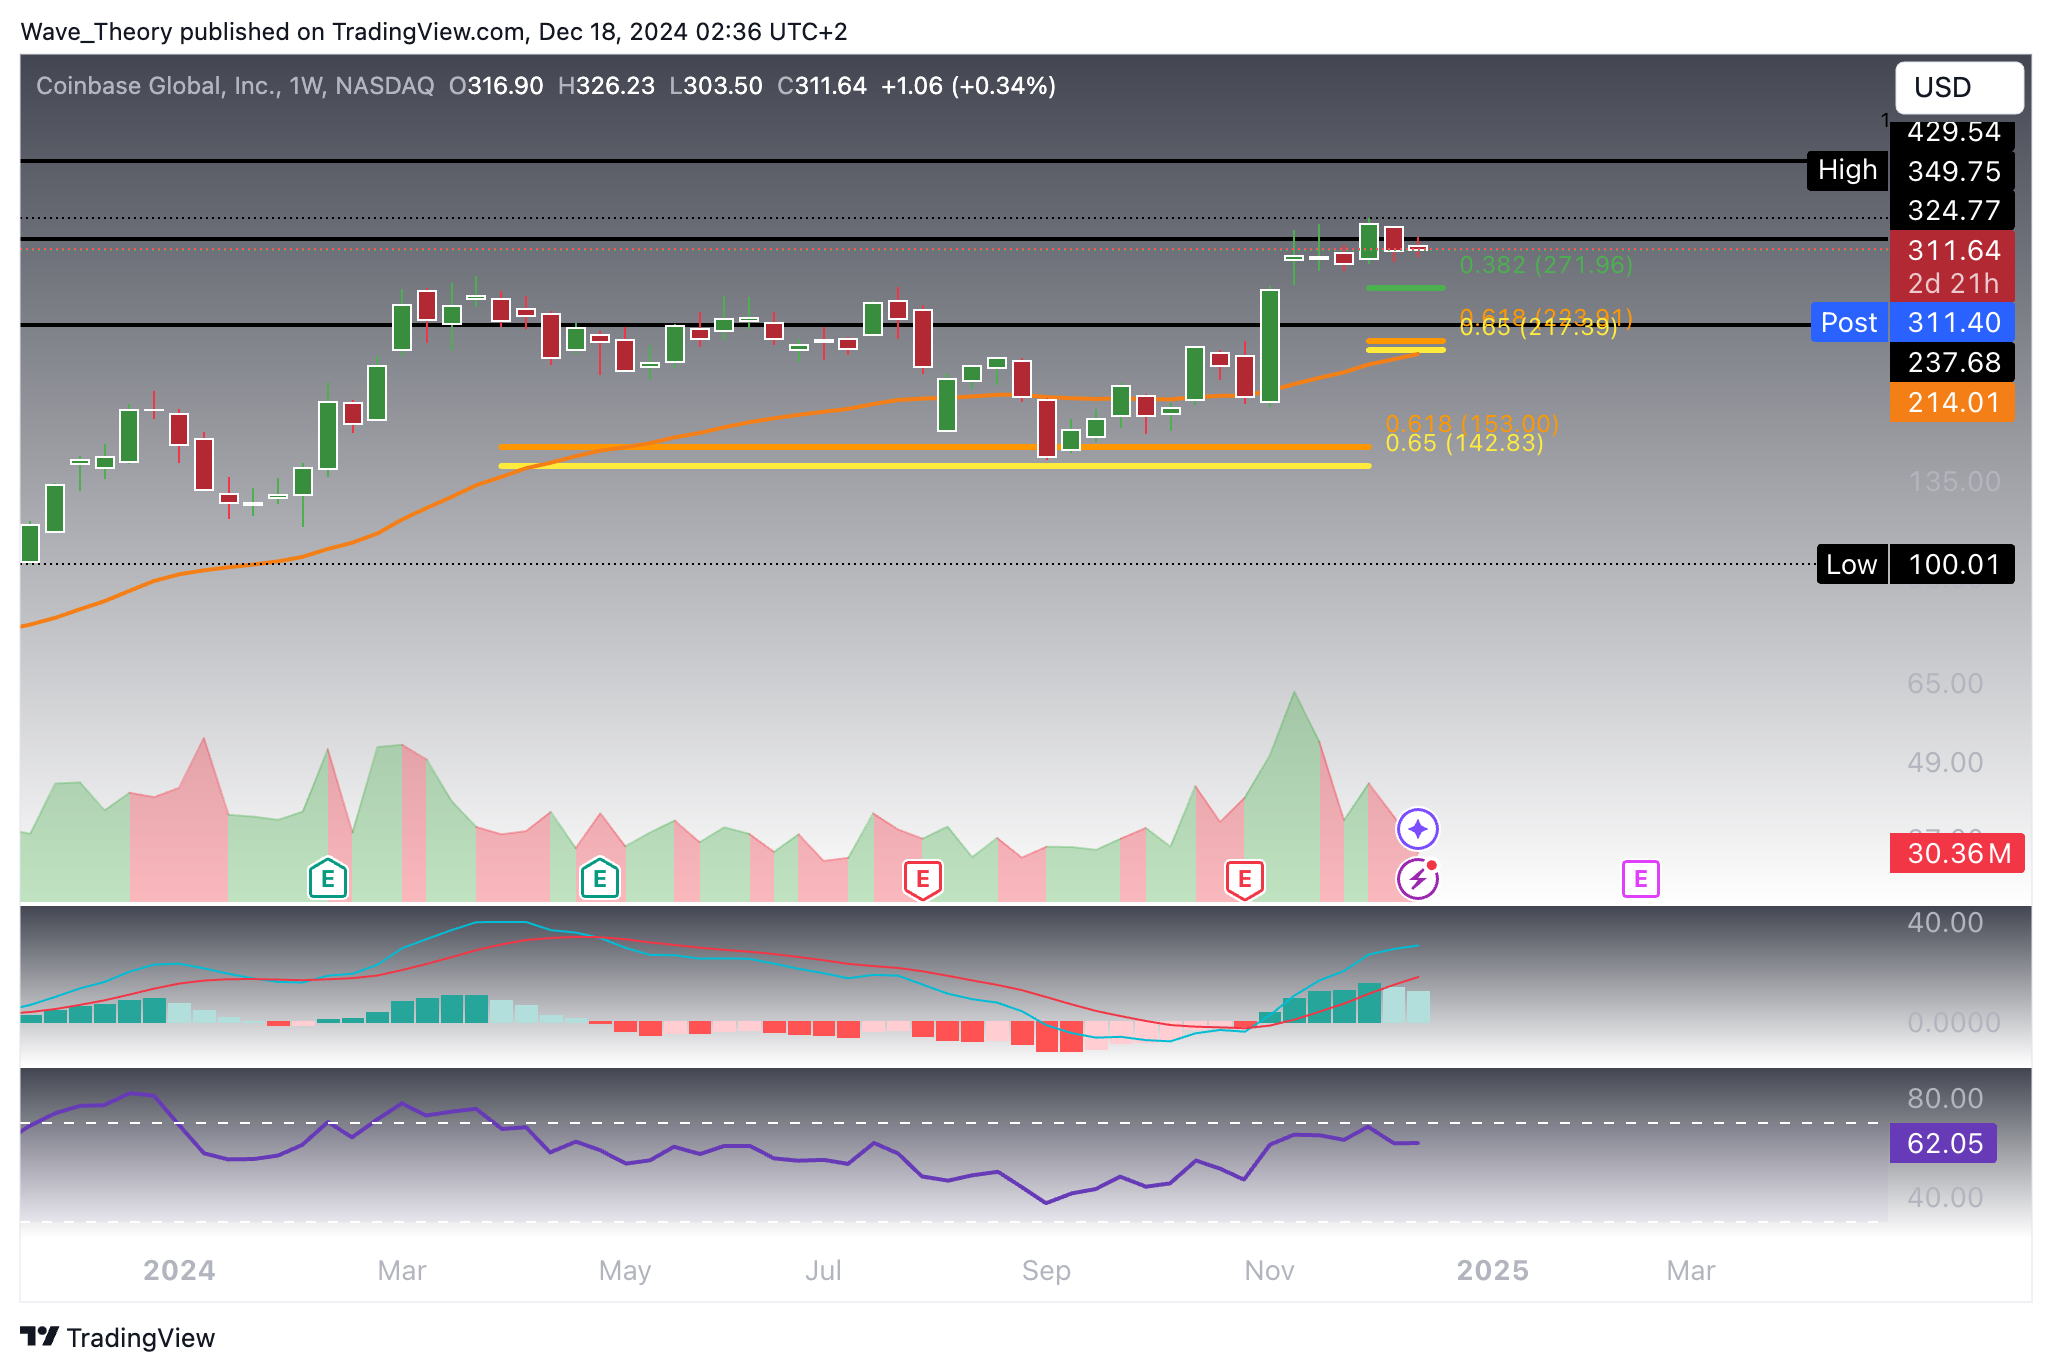
Mixed Signals On The Weekly Chart
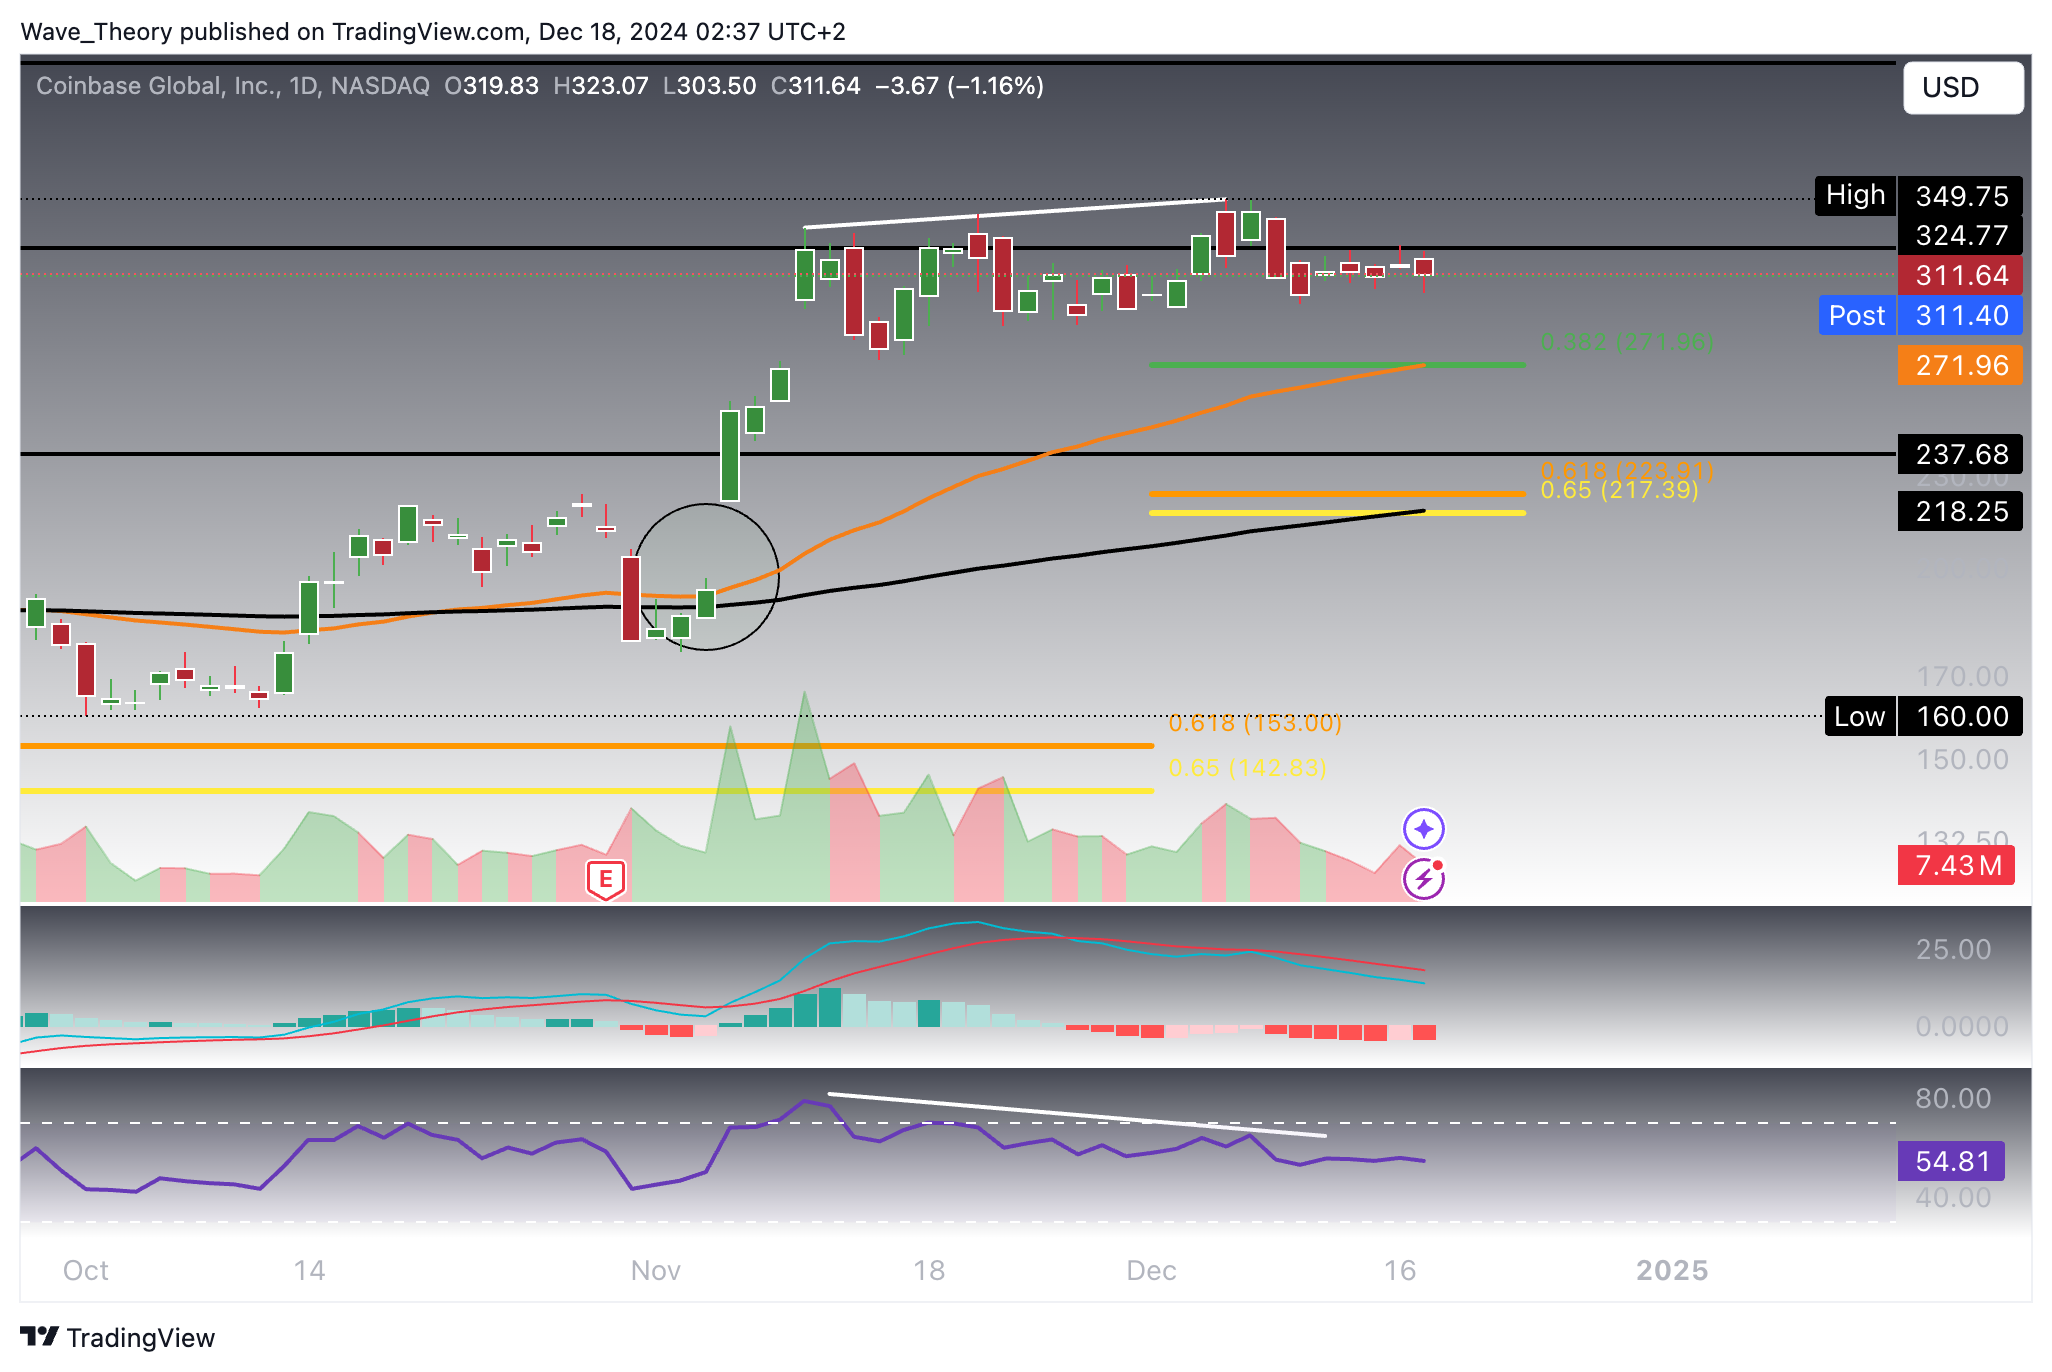
A short-term correction for Coinbase (COIN) seems imminent based on key indicators. The RSI is showing a bearish divergence on the daily chart, signaling a potential reversal of the upward trend. Meanwhile, the MACD lines have crossed bearishly, and the histogram is trending lower, further supporting the likelihood of a near-term pullback.
Coinbase could correct down to the 0.382 Fibonacci support level, coinciding with the 50-day EMA at $272. Should COIN break below this support, the stock could retrace further to the golden ratio support, aligning with the 200-day EMA at $218. These levels will act as critical supports to watch during the correction phase.
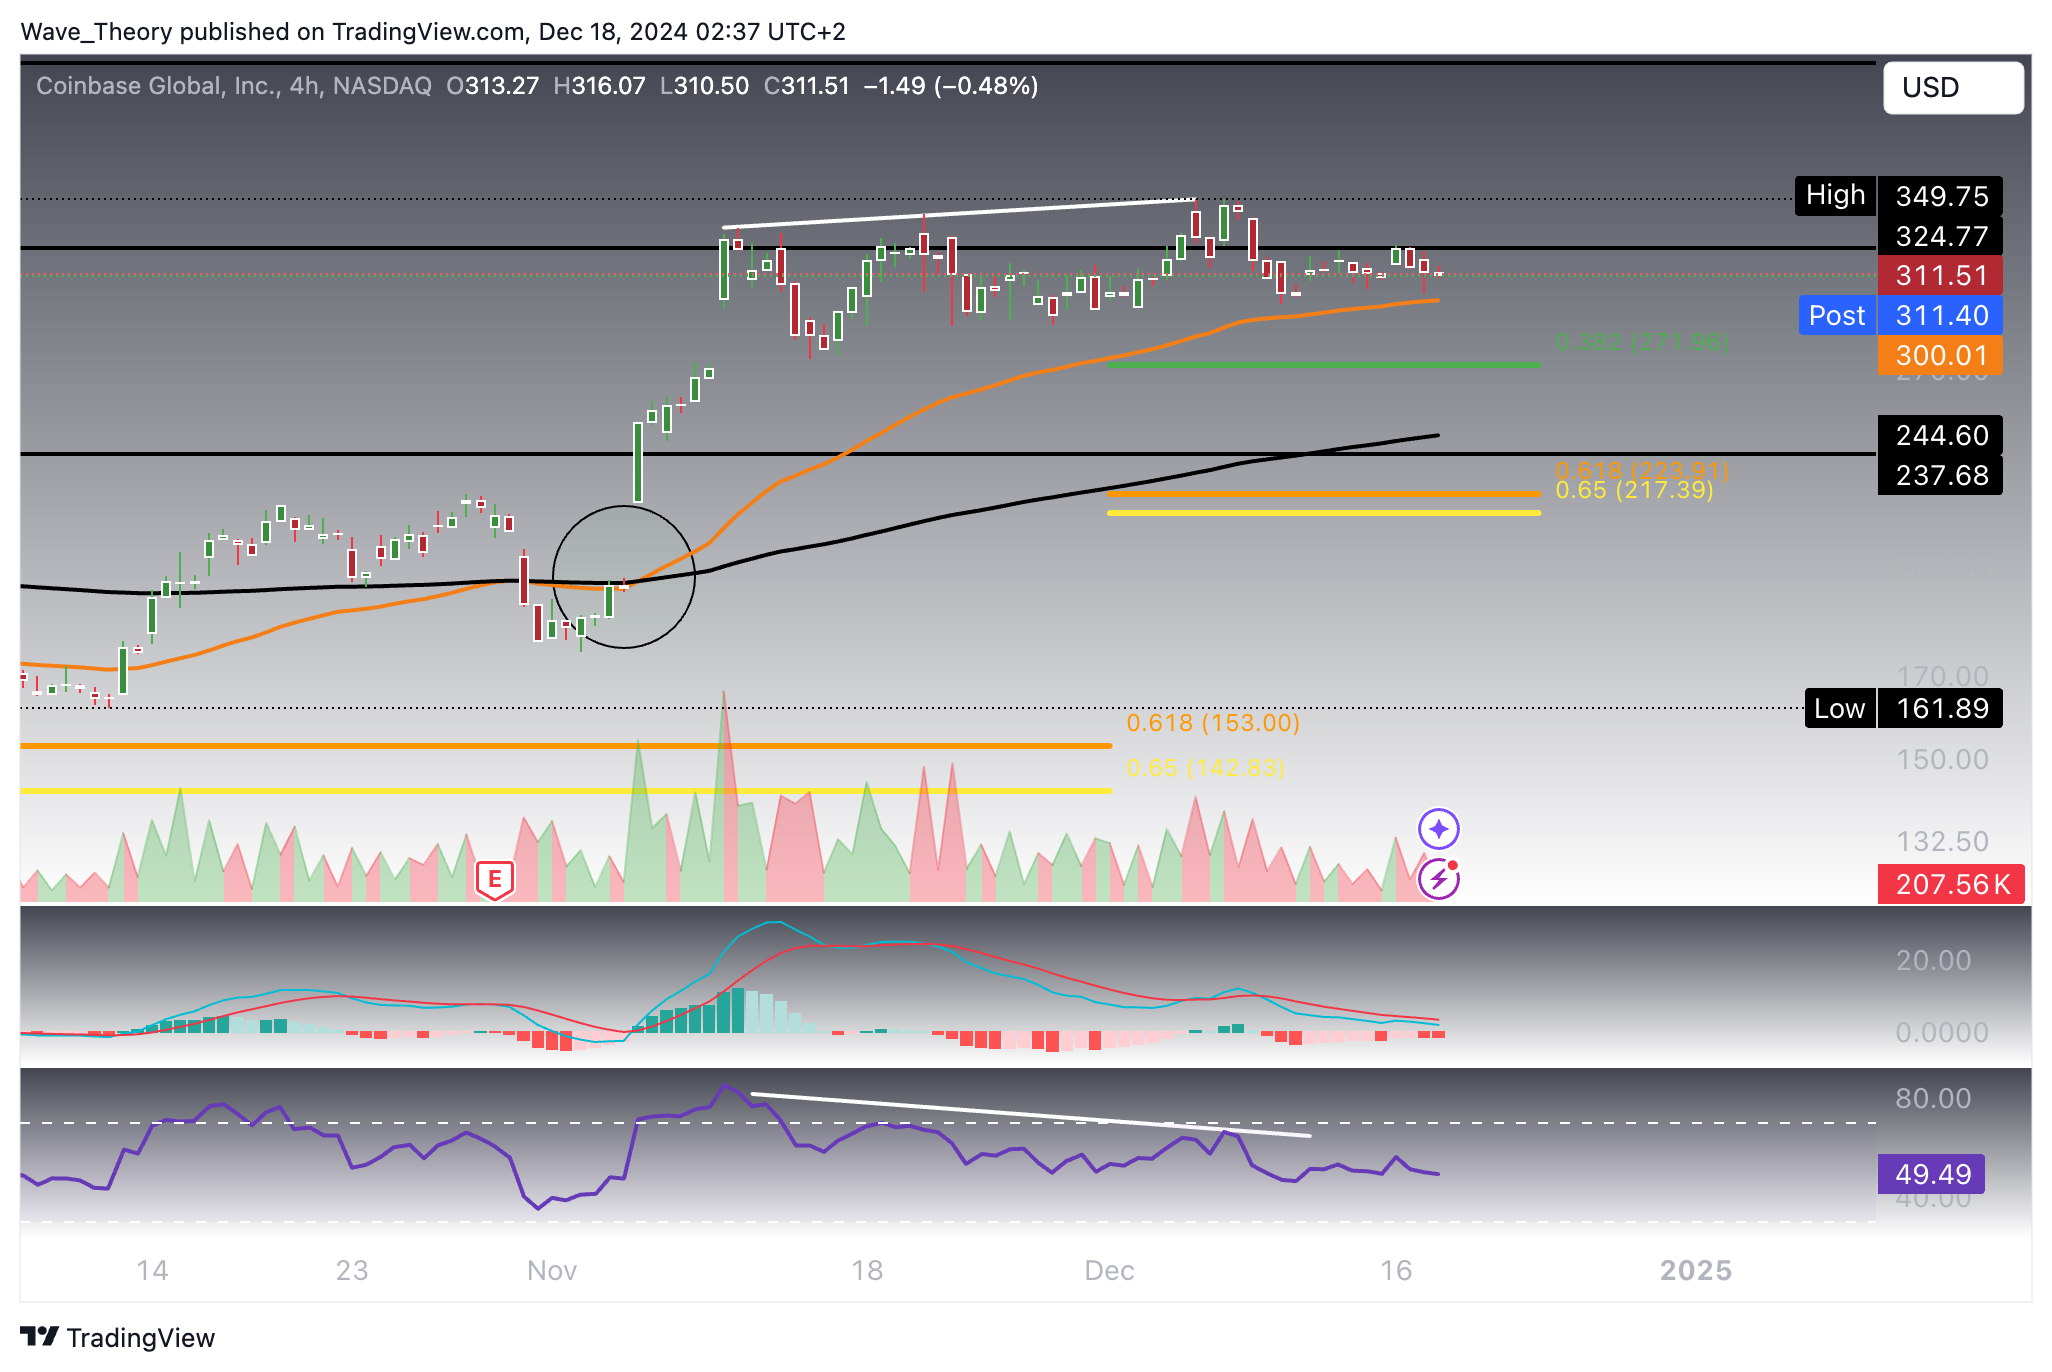
Similar Outlook On The 4H Chart
On the 4-hour (4H) chart, Coinbase exhibits similar technical signals as seen on the daily timeframe. The RSI is showing a bearish divergence, indicating weakening momentum, while the MACD lines have crossed bearishly, with the histogram continuing to tick lower. Coinbase now finds immediate support at the 50-4H-EMA near the $300 level. Should this support fail to hold, the price could target lower Fibonacci retracement levels.
Despite these short-term bearish signals, the overall trend remains bullishly confirmed, as the EMAs continue to display a golden crossover, signaling an intact upward trend even on shorter timeframes. This suggests that while a correction may occur, the bullish structure is still in place for a potential continuation of the uptrend.
- Check out our free forex signals
- Follow the top economic events on FX Leaders economic calendar
- Trade better, discover more Forex Trading Strategies
- Open a FREE Trading Account
- Read our latest reviews on: Avatrade, Exness, HFM and XM
ABOUT THE AUTHOR
See More
Konstantin Kaiser
Financial Writer and Market Analyst
Konstantin Kaiser comes from a data science background and has significant experience in quantitative trading. His interest in technology took a notable turn in 2013 when he discovered Bitcoin and was instantly intrigued by the potential of this disruptive technology.
Related Articles
Sidebar rates
