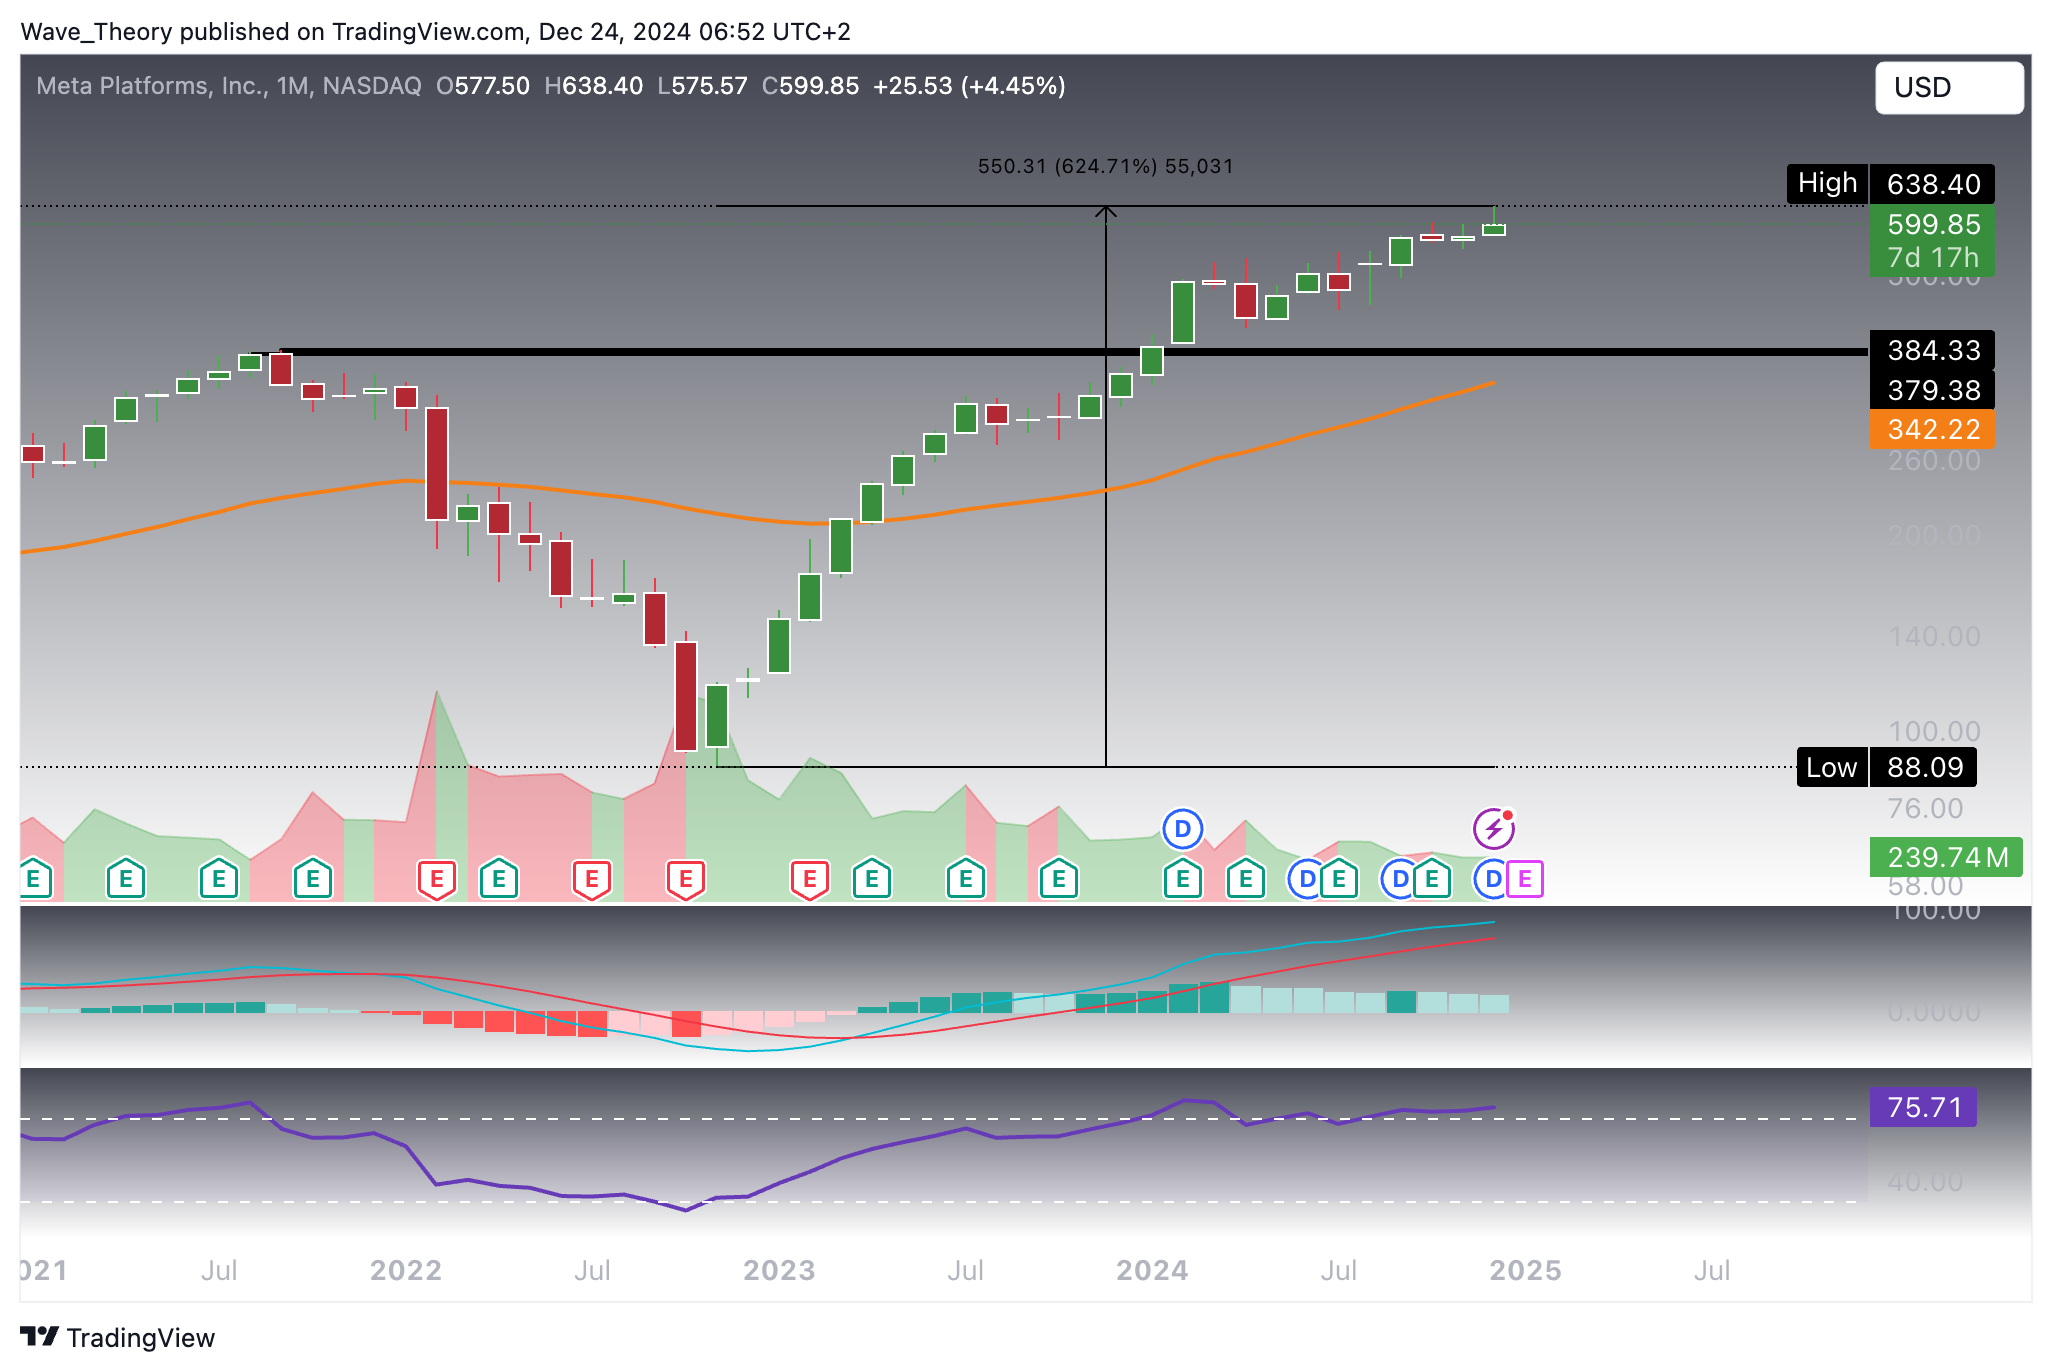
META Stock Surges in Massive Uptrend: Is a New High on the Horizon?

META stock has exhibited a significant uptrend over the past two years, surging from $88 to $638—a remarkable increase of over 624%. With such strong momentum, the key question remains: Can META sustain this impressive trajectory, or is a potential correction on the horizon?

Weakening Bullish Momentum on META’s Monthly Chart Indicators

On the monthly chart, the MACD histogram has been ticking lower for the past three months, signaling weakening bullish momentum. Simultaneously, the RSI is approaching overbought territory and showing a slight bearish divergence, indicating that the upward momentum may be losing strength.

META

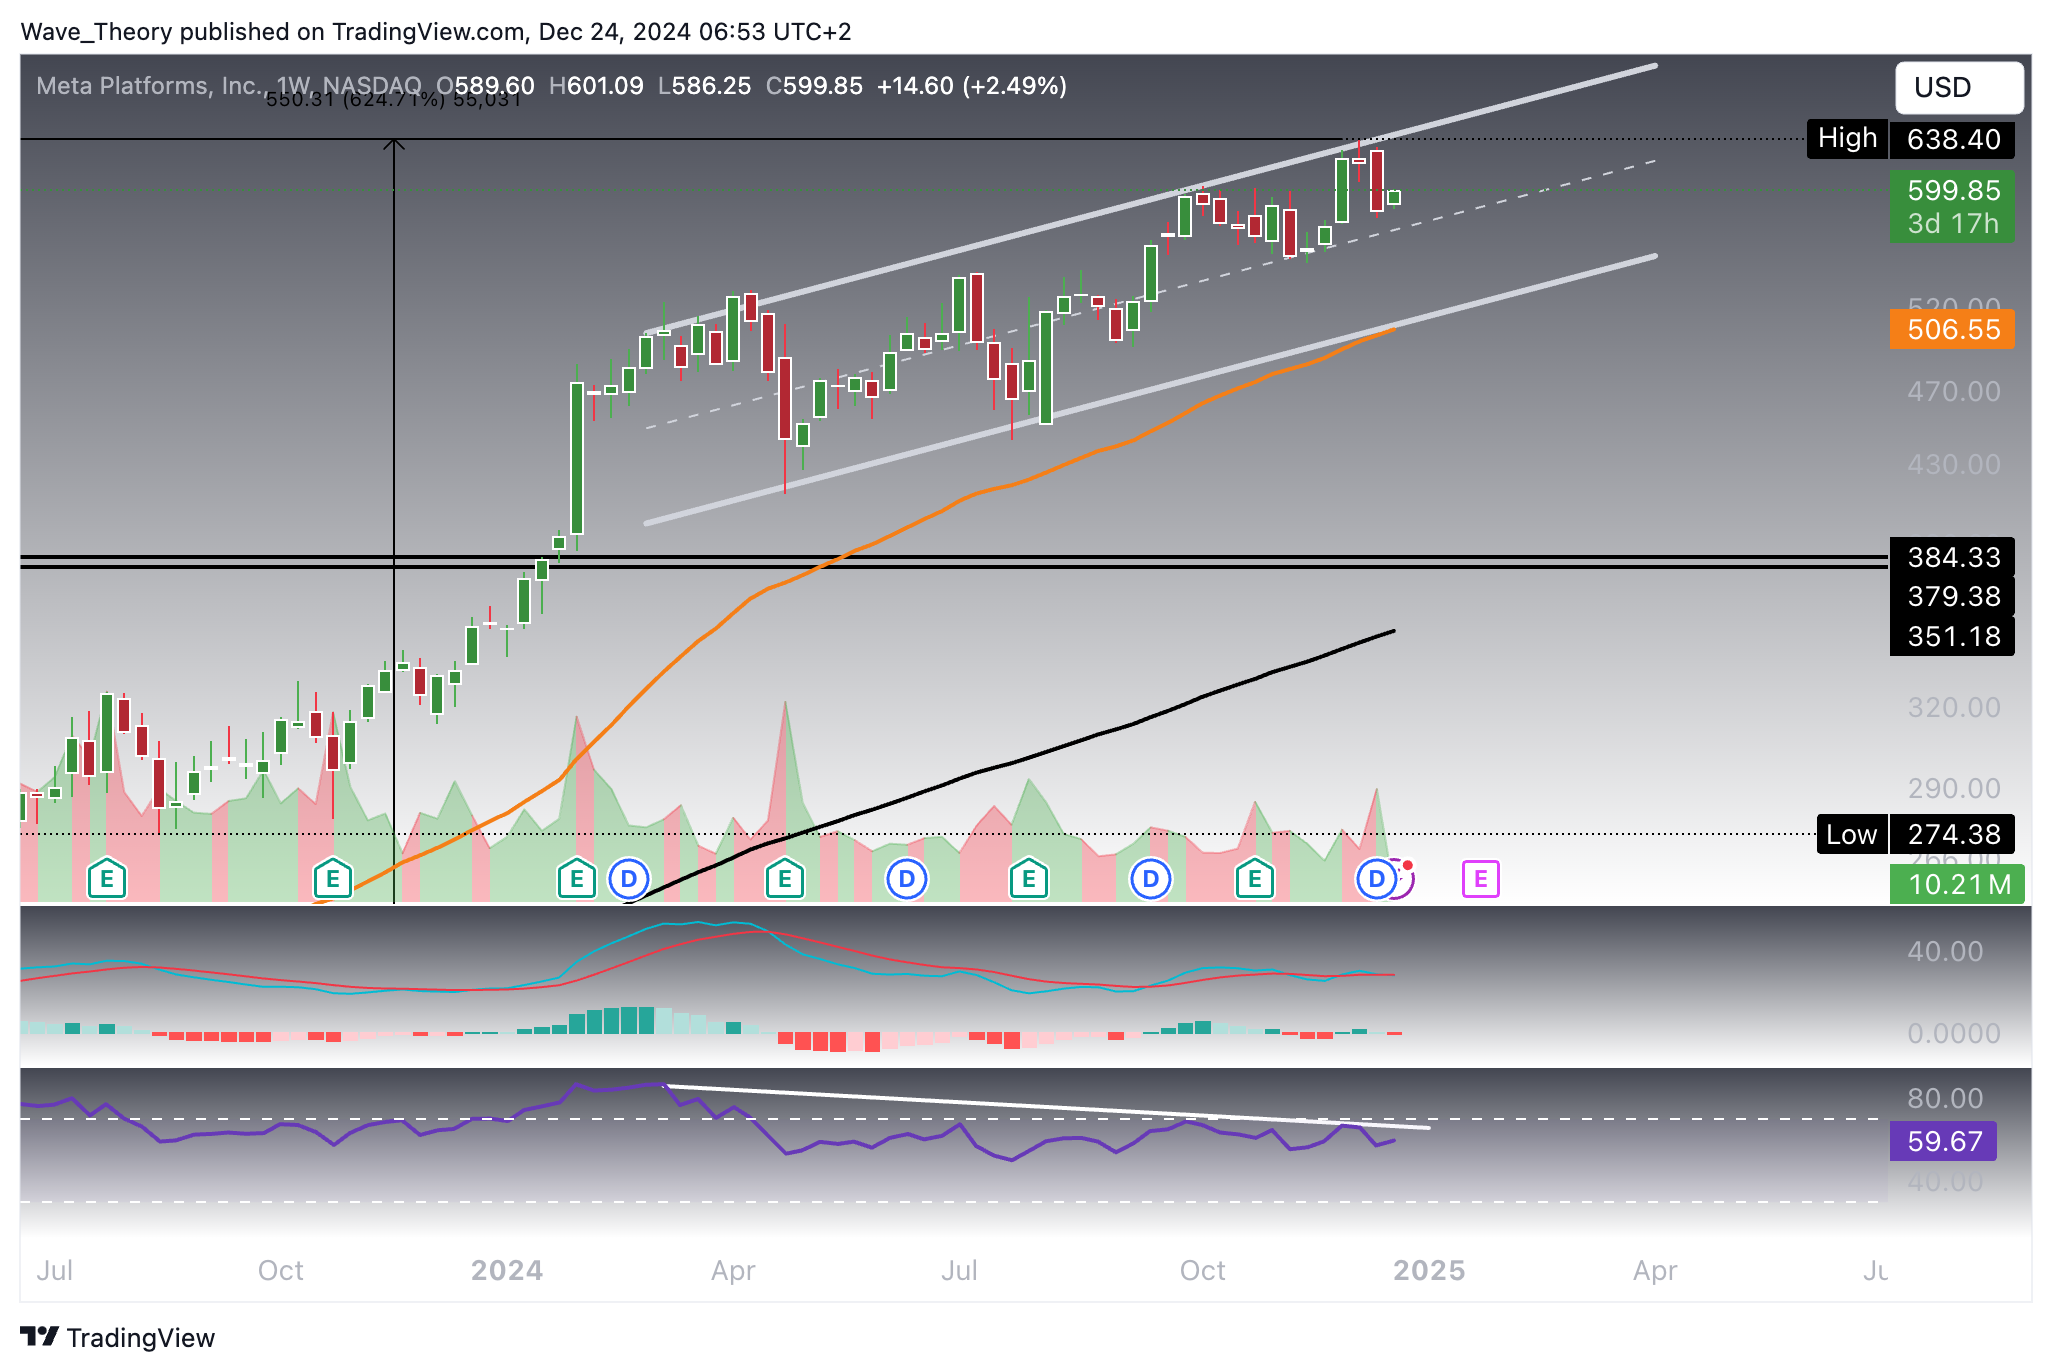
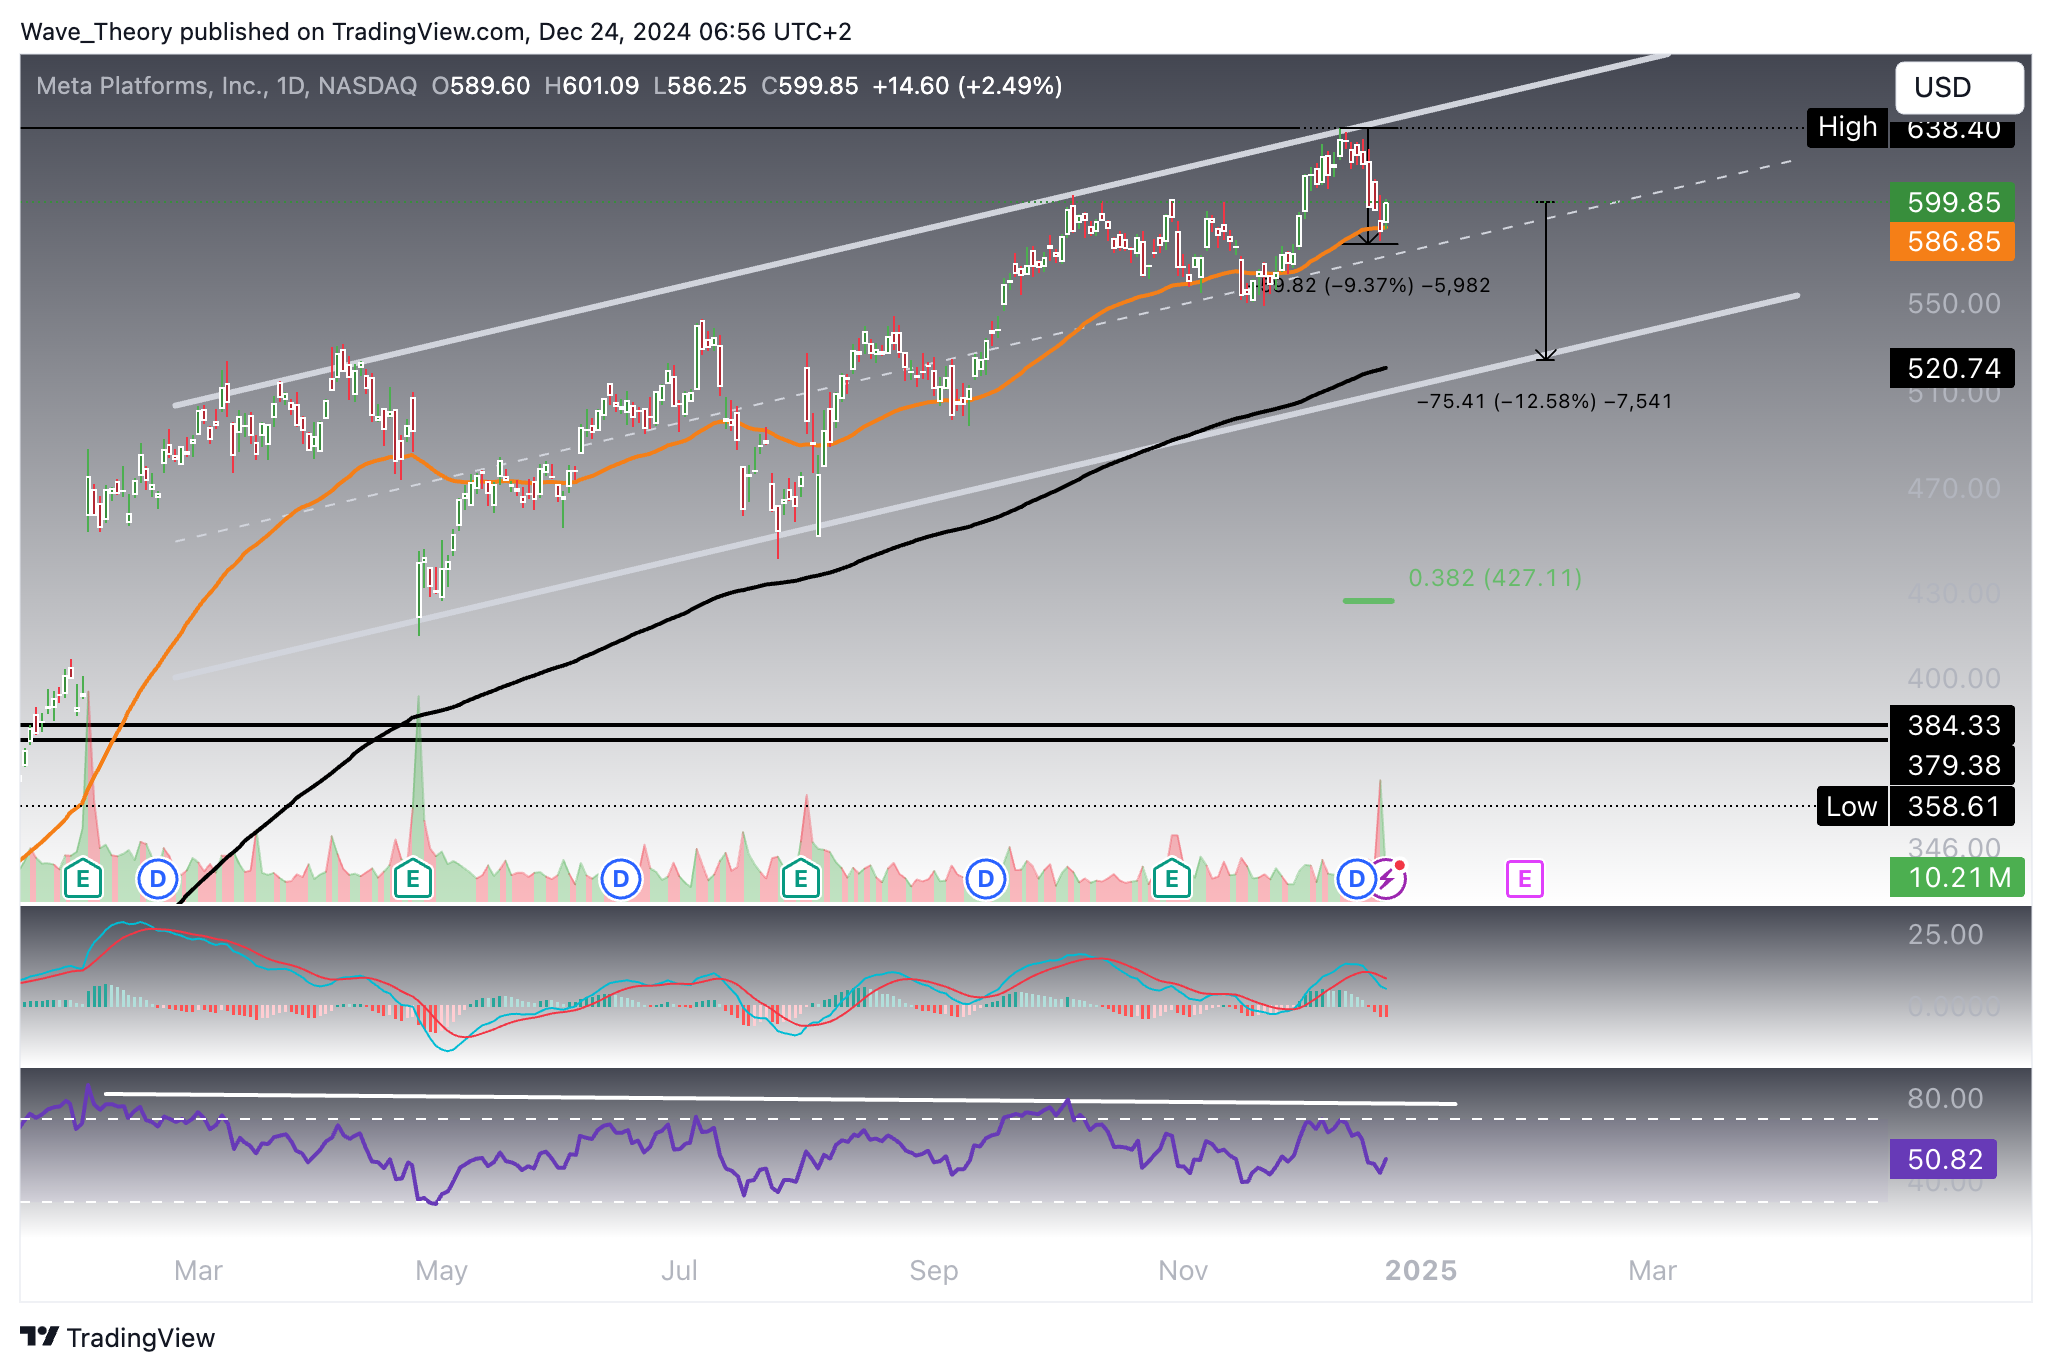
META Stock Moves Within Parallel Upward Channel, Eyes Key Support at $50

On the weekly chart, META stock is trading within a parallel upward channel, frequently gravitating toward the middle line with occasional corrections down to the lower channel support. This support level aligns with the 50-week EMA, which currently acts as significant support at $507.

The indicators, however, present mixed signals. While the EMAs confirm the mid-term bullish trend due to their golden crossover formation, the RSI is showing a bearish divergence, and the MACD lines have crossed bearishly, with the MACD histogram ticking lower for the past two months.

A retracement toward the channel support at $507 is possible in the mid-term, but the overall bullish trend remains intact.

META

META Stock Could See a 13 % Correction

The META stock may be poised for a 13 % correction. After a 9.4 % pullback, it found temporary support by bouncing off the 50-day EMA at $587. However, the daily chart presents mixed signals. The RSI remains in neutral territory, while the EMAs confirm the bullish trend in the short-to-medium term with a golden crossover formation. On the other hand, the MACD lines have crossed bearishly, and the MACD histogram is ticking lower, suggesting potential downside momentum.

META

To summarize, the META stock has experienced strong bullish momentum but is showing signs of a potential 13% correction. While the EMAs confirm the uptrend with a golden crossover, bearish signals from the MACD and mixed indicators suggest a short-term retracement before resuming its upward trajectory.

Check out our free forex signals
Follow the top economic events on FX Leaders economic calendar
Trade better, discover more Forex Trading Strategies
ABOUT THE AUTHOR See More
contact.me.konstantin@gmail.com
Konstantin Kaiser
Financial Writer and Market Analyst
Konstantin Kaiser comes from a data science background and has significant experience in quantitative trading. His interest in technology took a notable turn in 2013 when he discovered Bitcoin and was instantly intrigued by the potential of this disruptive technology.
Related Articles
Comments
0 0 votes
Article Rating
Subscribe
Notify of
0 Comments
Oldest
Newest Most Voted
Inline Feedbacks
View all comments