Rigetti Computing Inc. (NASDAQ: RGTI) is a pioneering force in the quantum computing sector, renowned for its state-of-the-art quantum processors and full-stack quantum computing systems. By forging strategic partnerships with industry giants like Microsoft Azure Quantum and NVIDIA, Rigetti is accelerating the integration of quantum software with classical computing frameworks, positioning itself for future growth. With quantum computing rapidly evolving, a key question emerges: Could RGTI stock follow a similar trajectory to Nvidia’s meteoric rise?
RGTI Stock Soared Over 3,276% in the Past Five Months
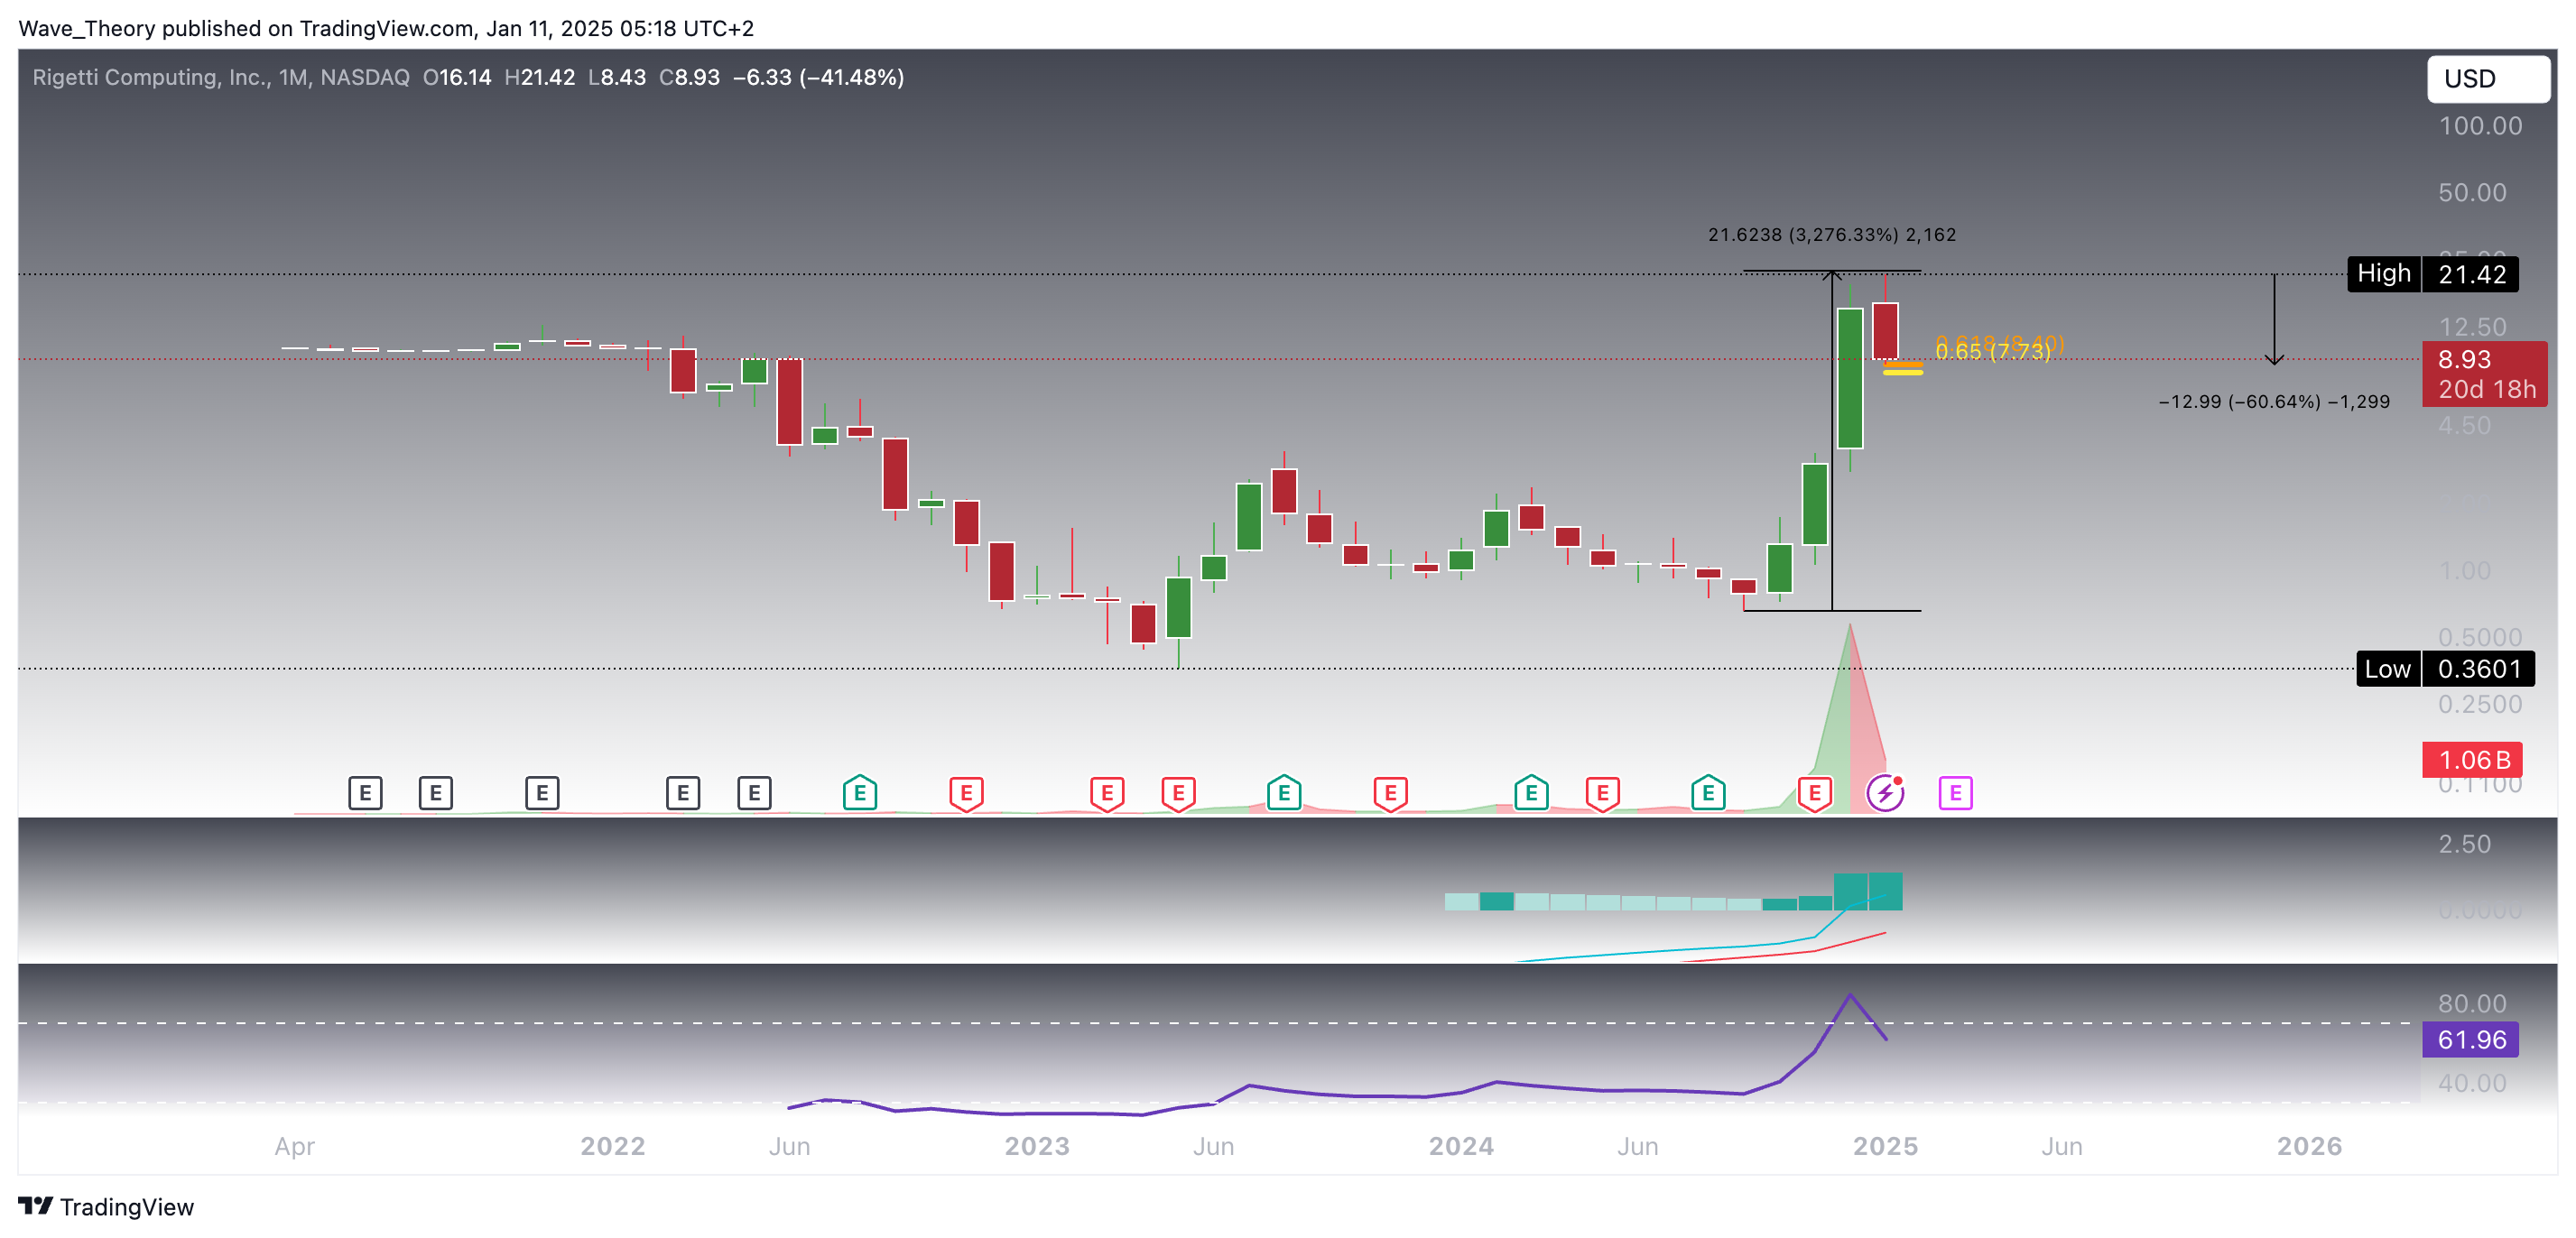
In the past five months, RGTI stock has experienced an extraordinary surge, gaining more than 3,276% and setting a new all-time high (ATH). The technical indicators continue to support the bullish momentum. The MACD histogram has been ticking higher for months, reflecting sustained upward strength, while the MACD lines remain in a bullish formation, signaling continued buying pressure. Although the RSI has recently retreated from overbought conditions, it is now returning to neutral levels, suggesting the possibility of further consolidation before the next potential leg higher. These indicators suggest a strong bullish trend with room for further growth in the coming sessions.
In the current month, however, RGTI has entered a corrective phase, retracing by more than 60% from its recent highs. This pullback has brought the stock to a critical support level, where a potential bounce could occur if buyers step in. The market is now at a pivotal point, and this level will be crucial to watch in determining whether the correction is temporary or if further downside is on the horizon.
RGTI
RGTI’s Weekly Histogram Is Showing Weakening Bullish Momentum
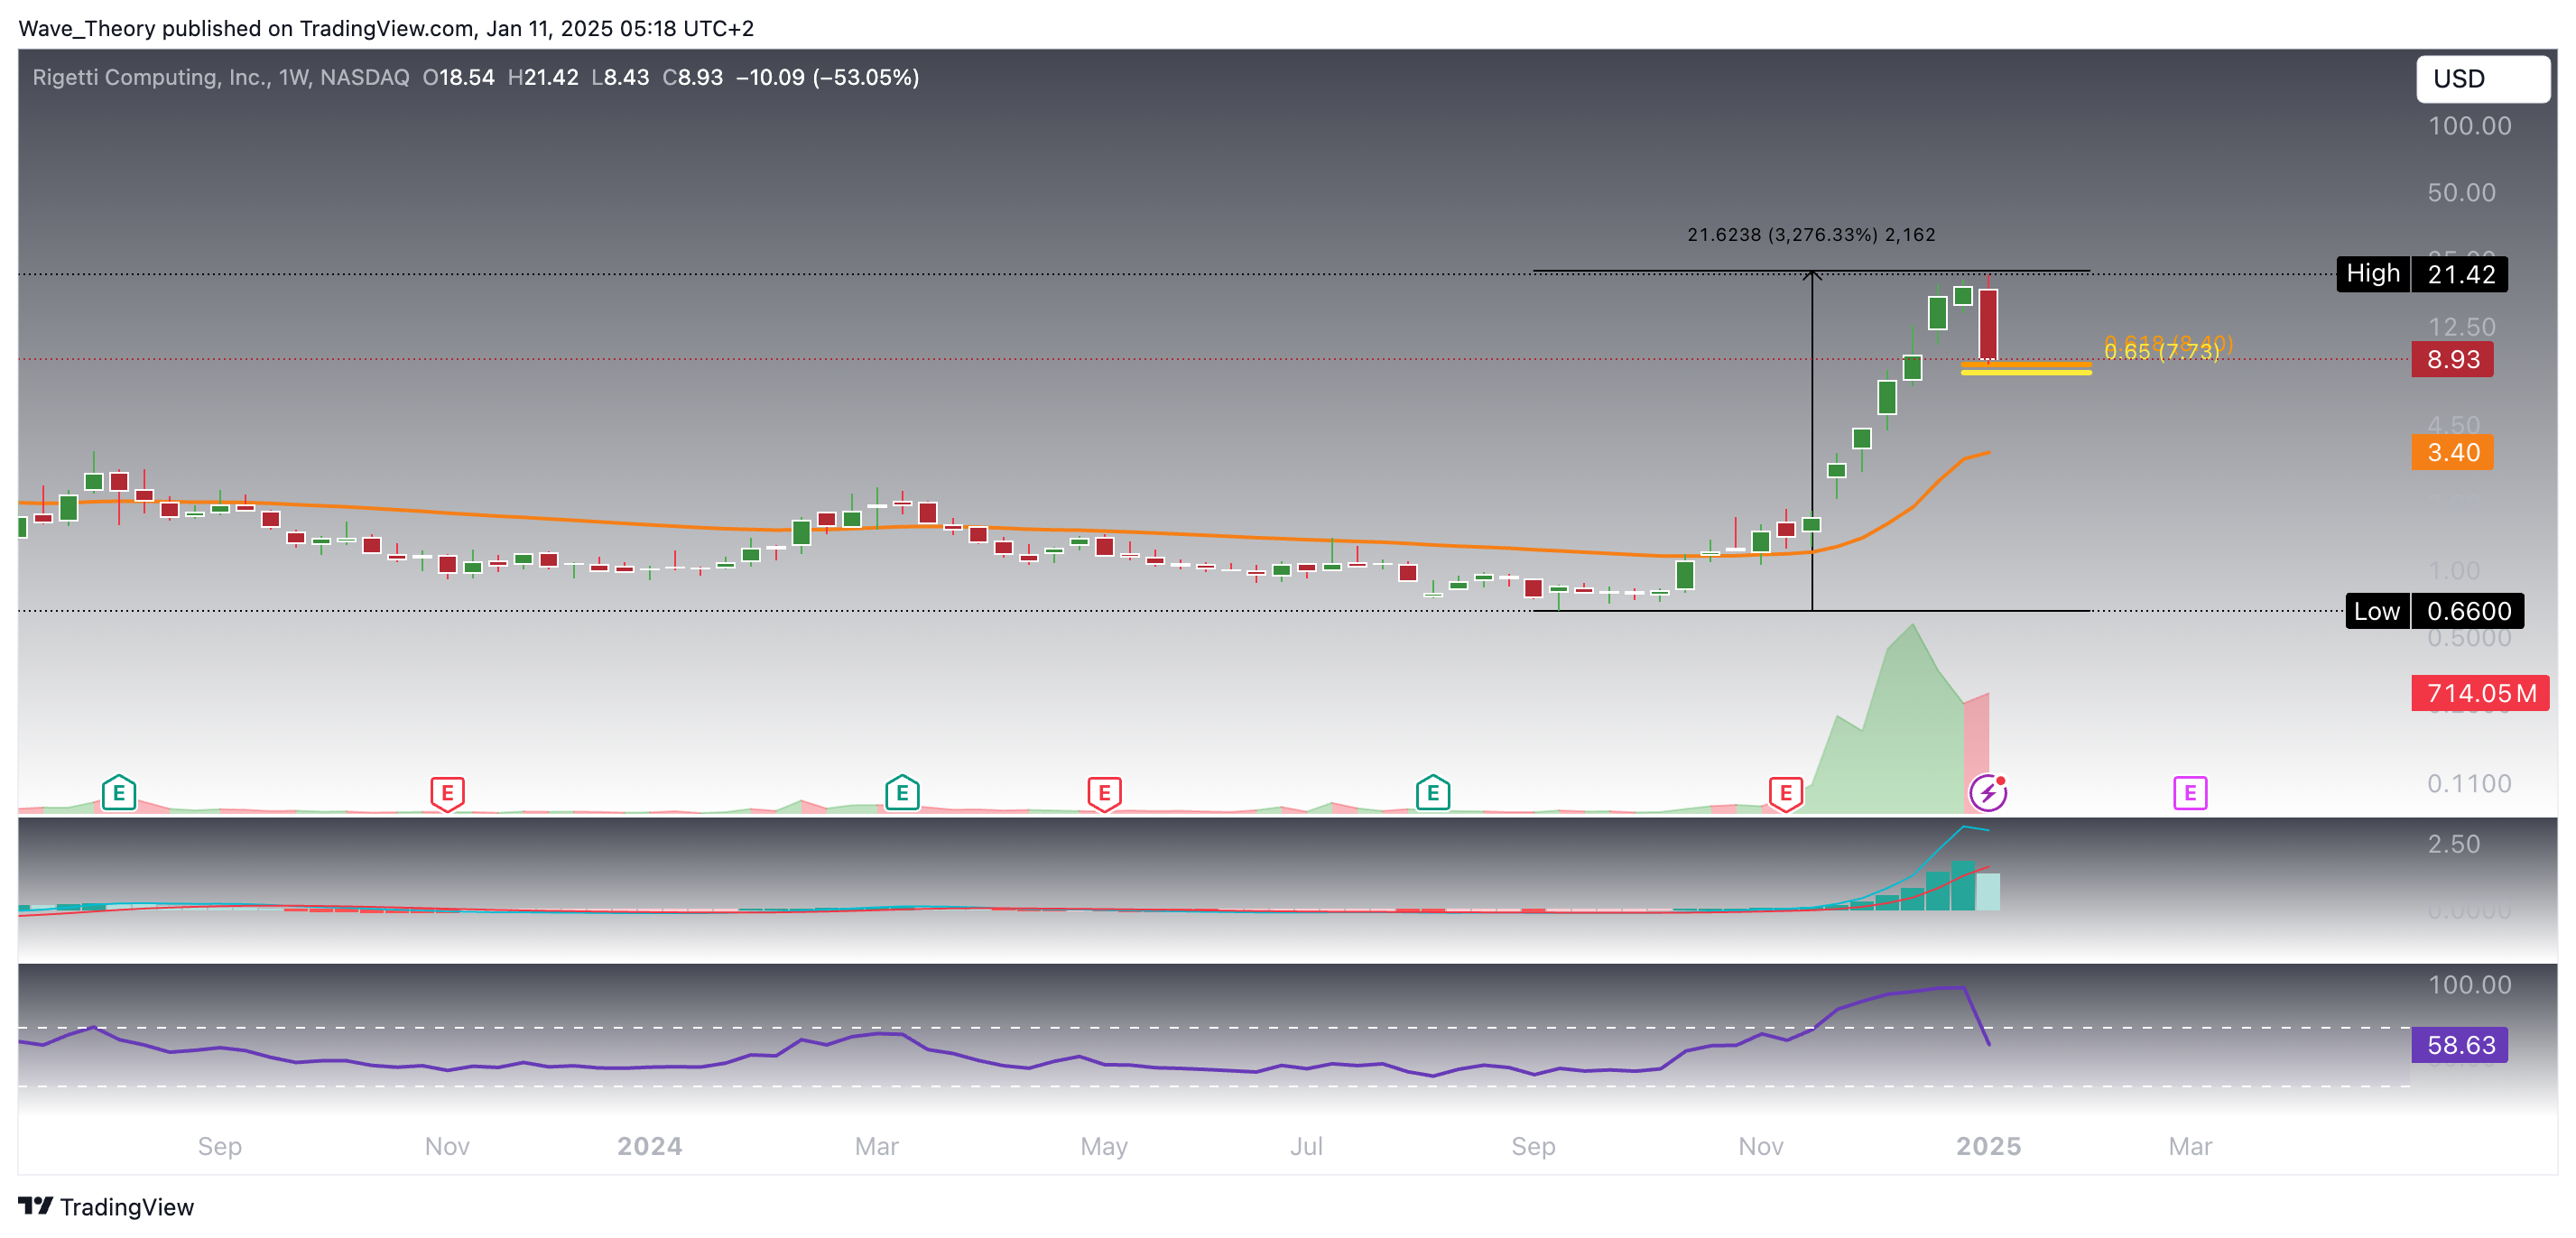
This week’s price action has driven the entirety of RGTI’s downward movement, significantly pushing the MACD histogram lower, reflecting weakening momentum. However, the MACD lines remain bullishly crossed, indicating that the overall trend is still intact for now. Meanwhile, the RSI is in neutral territory, providing no clear bullish or bearish signals at this point.
A key level to watch is the golden ratio support at $7.7—if RGTI breaks below this level, it could extend its correction toward the 50-week EMA at $3.4, a major support zone that could determine the next phase of price action.
RGTI
Is This the Perfect Entry Point for RGTI Bulls Despite Mixed Technical Indicators?
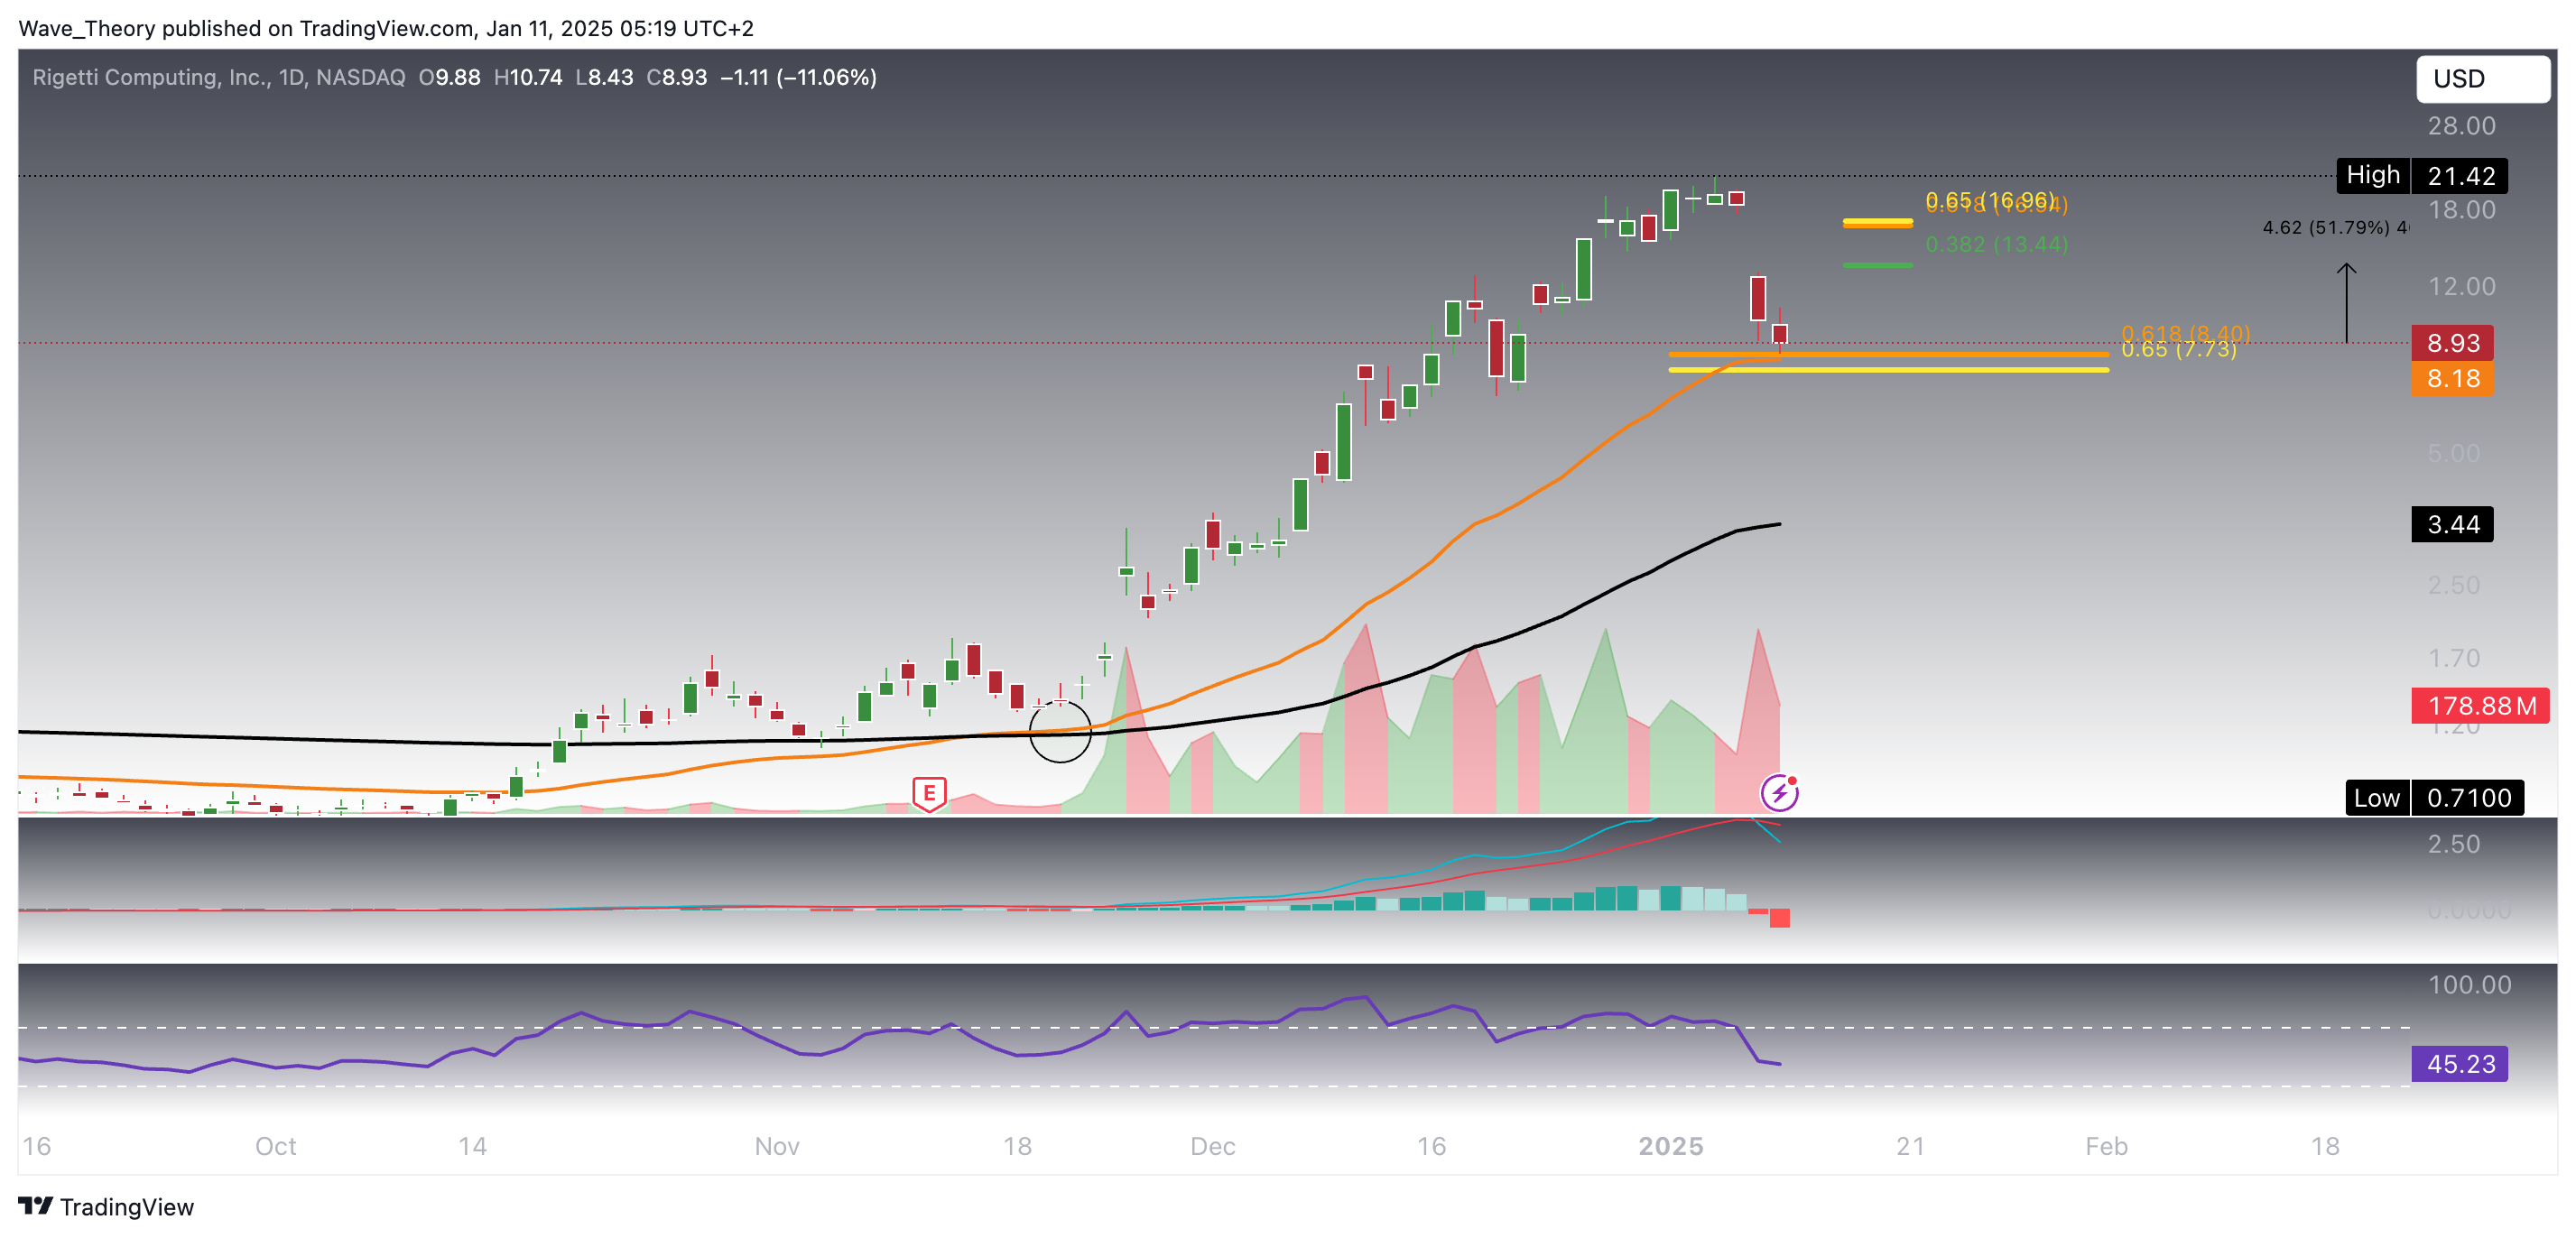
RGTI has now reached a critical support zone, with the 50-day EMA providing additional support. Although the MACD lines have crossed bearishly on the daily chart, and the histogram continues to tick lower, there remains a chance for RGTI to bounce off this support and resume its upward movement. If this occurs, the stock could rally to the next significant Fibonacci resistance at $13.44, indicating an upward potential of roughly 52%.
Should RGTI break through this Fib resistance, it could surge further to the golden ratio level at $17. A decisive break above this level would invalidate the current corrective phase and open the possibility for a move toward a new all-time high (ATH).
Additionally, the RSI remains neutral, neither overbought nor oversold, while the golden crossover of the EMAs confirms a bullish trend in the short- to medium-term. These mixed signals highlight the importance of upcoming price movements in determining whether RGTI can sustain its bullish momentum.
RGTI
Similar Outlook On The 4H Chart
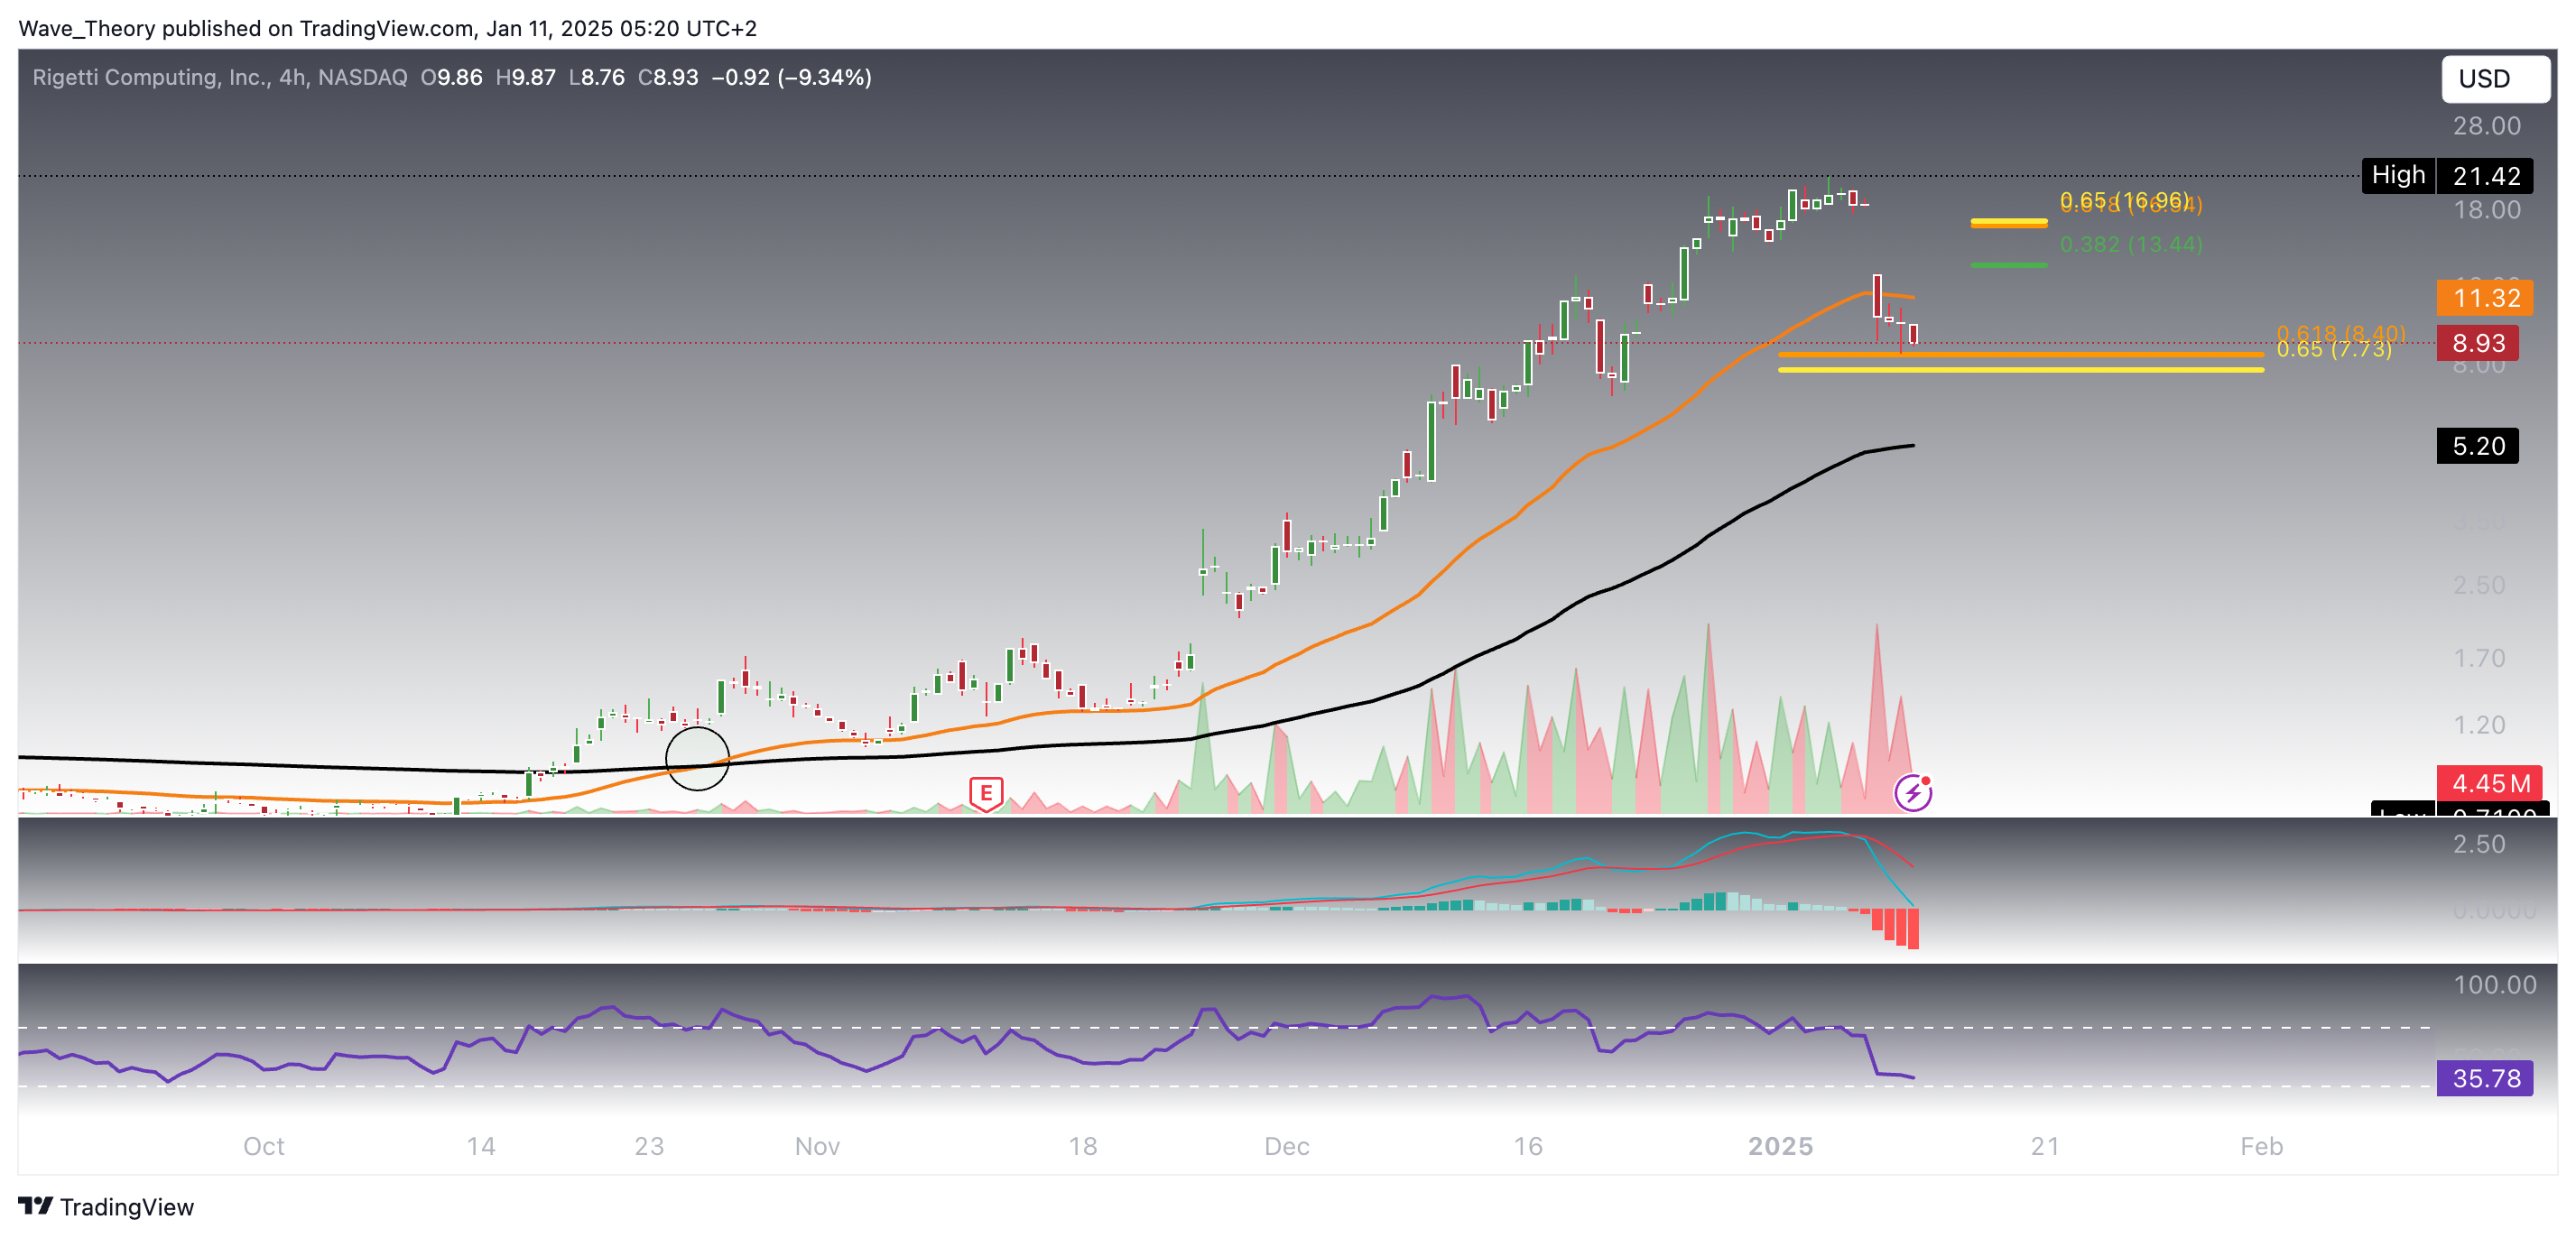
On the 4H chart, the technical indicators present a mixed picture, reflecting a balance between bullish and bearish signals. The EMAs have formed a golden crossover, signaling a confirmation of the short-term bullish trend. However, the RSI is in a neutral position, providing no clear direction. The MACD, on the other hand, is notably bearish, with the MACD lines having crossed bearishly, and the histogram showing a clear downtrend.
Despite these bearish signals, RGTI has touched critical Fibonacci support, which could act as a key level for a potential bullish bounce in the coming week. This setup creates an interesting opportunity for a reversal if the support holds, potentially leading to upward momentum in the near term.
Konstantin Kaiser comes from a data science background and has significant experience in quantitative trading. His interest in technology took a notable turn in 2013 when he discovered Bitcoin and was instantly intrigued by the potential of this disruptive technology.