Solana Whales Dumping as Network Surges – Is This a Buying Opportunity?
Solana (SOL) has encountered notable selling pressure, dropping below $170 before recovering to $176, even as the network demonstrates
Solana (SOL) has encountered notable selling pressure, dropping below $170 before recovering to $176, even as the network demonstrates remarkable technological adoption and usage metrics.
This decline comes amid broader cryptocurrency market uncertainty, with Bitcoin retreating to $90,600 and Ethereum falling to $3,100.
Solana Network Growth vs. Price Action: Conflicting Signals
Solana’s network data show a convincing picture of rising adoption despite a price weakness. Based on Nansen Analytics, Solana’s gas fees have shockingly exceeded Ethereum’s during the previous week, producing $32.2 million instead of Ethereum’s $25.5 million. With about 718.65 million transactions handled by the network, 87 times more than Ethereum, it clearly boasts exceptional scalability.
Strong Institutional Interest in SOL
According to JPMorgan’s most recent research, Solana investment products appeal greatly to institutions. Drawing on past adoption rates of Bitcoin and Ethereum investment vehicles, the bank estimates possible inflows of $3–6 billion into Solana ETPs. Solana-tied ETPs now under management have assets worth about $1.6 billion.
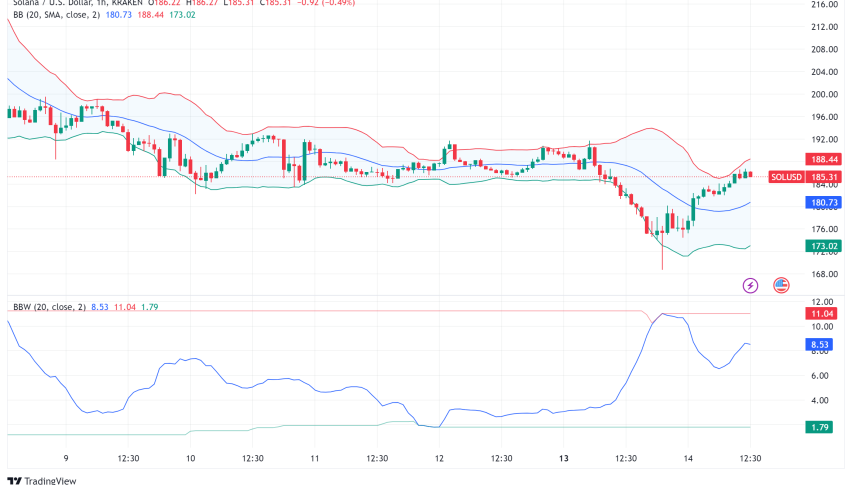
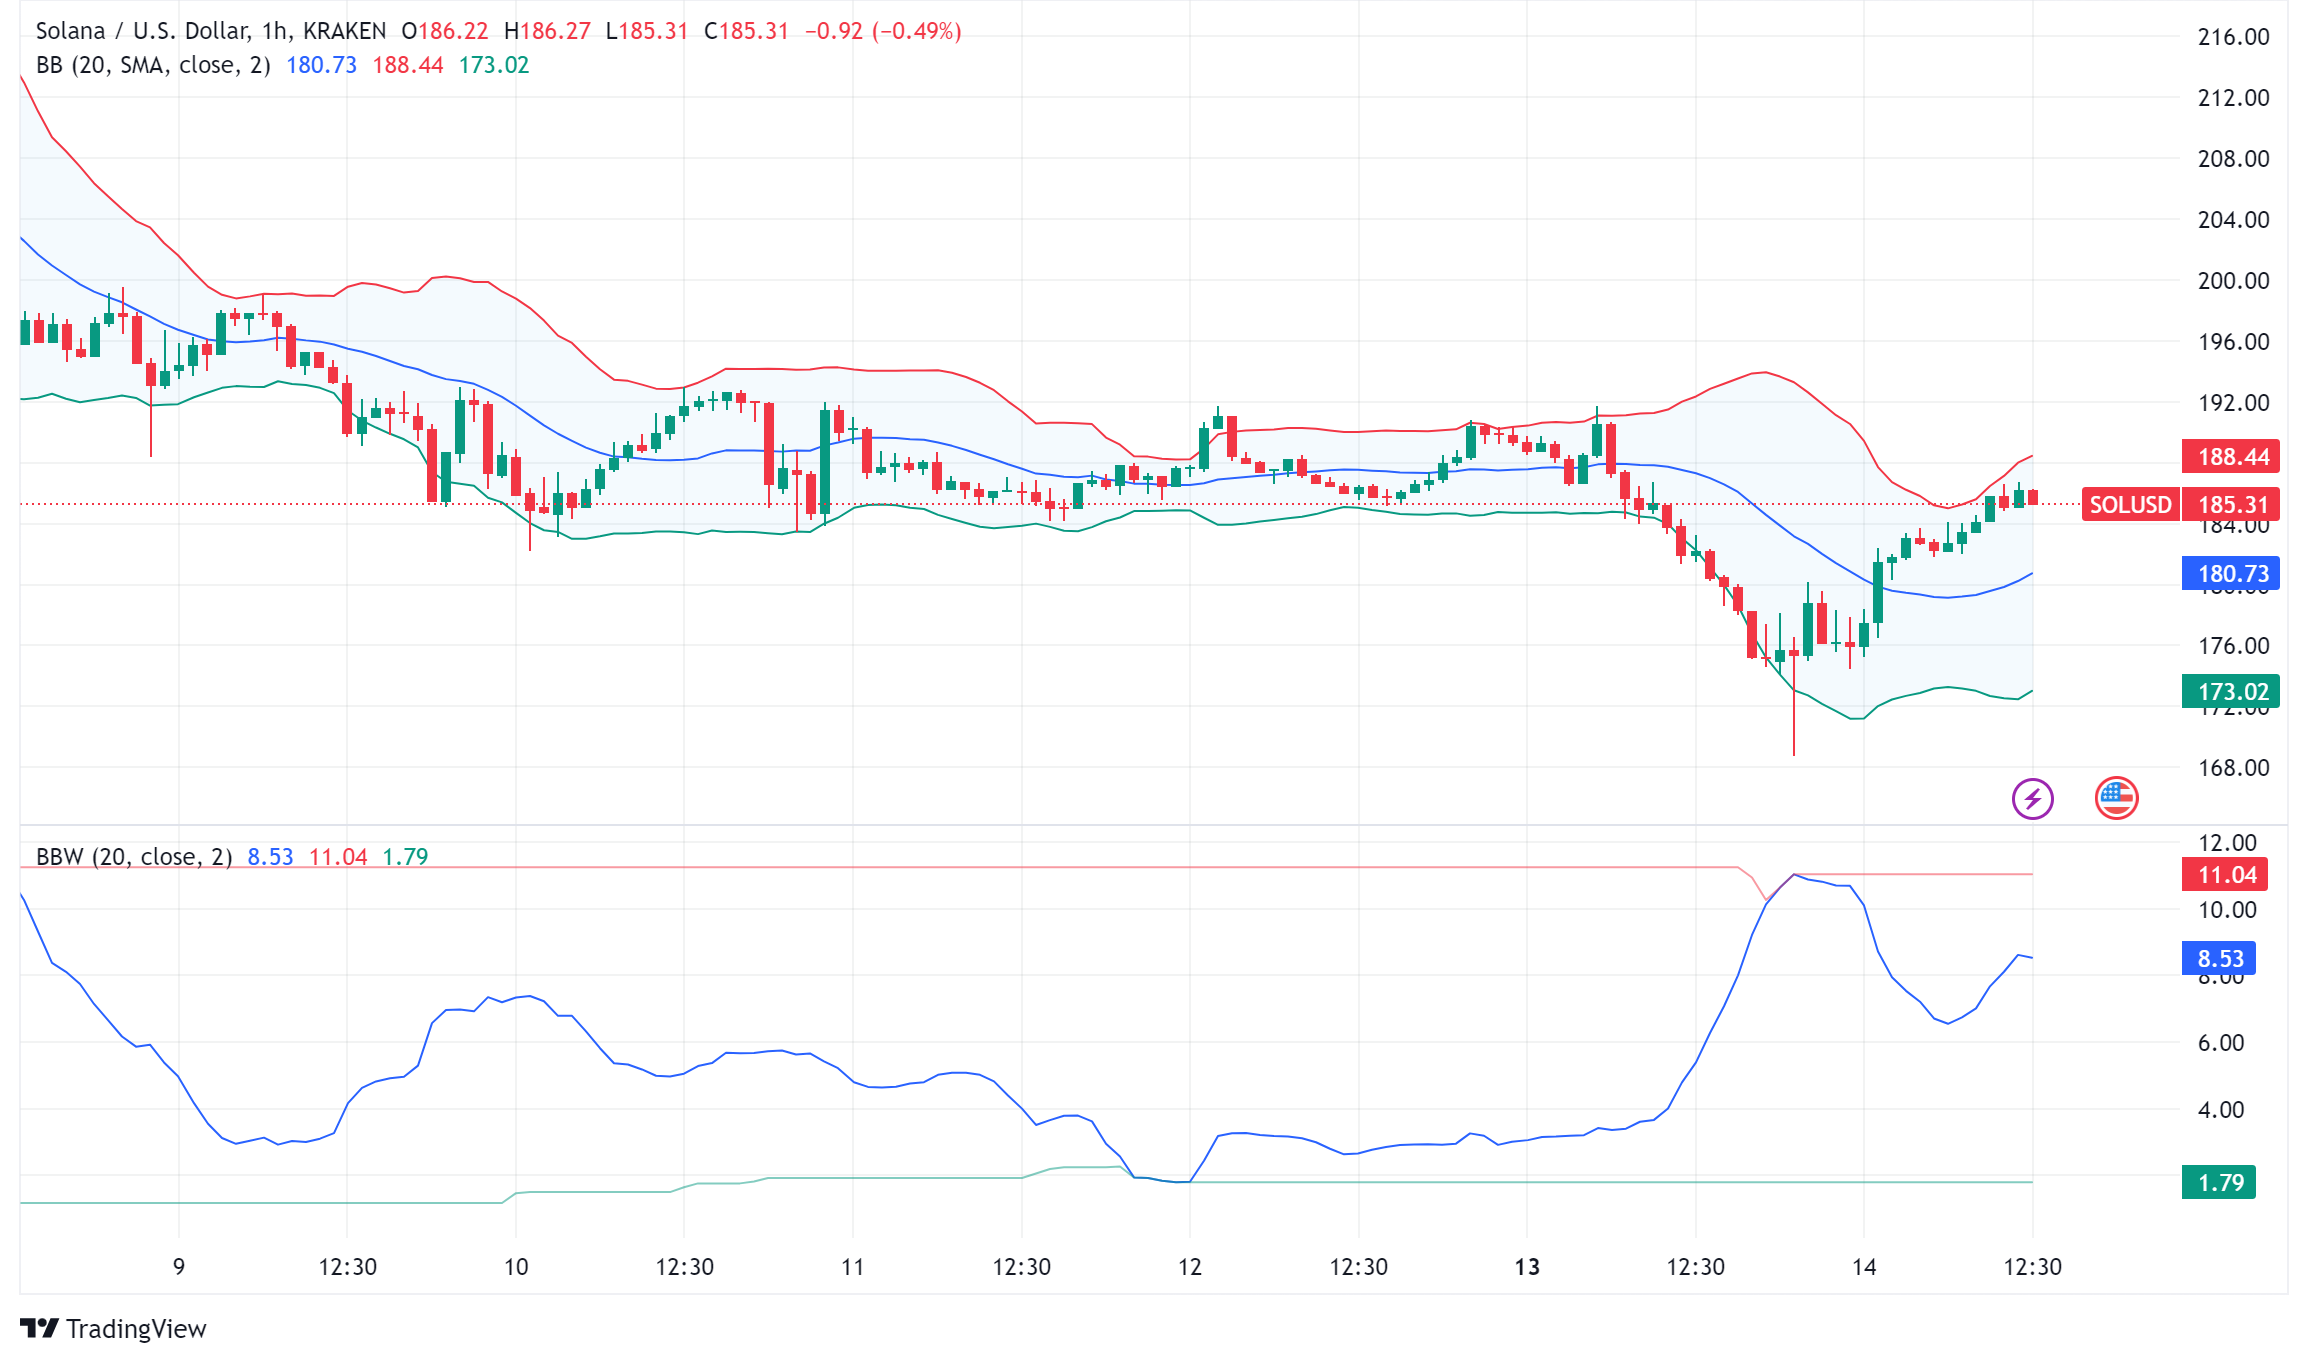
SOL/USD Technical Analysis and Price Outlook
The technical picture shows increasing bearish pressure:
- SOL/USD is trading below its 20-day moving average
- Daily trading volume has surged to 4.68 million
- The Choppiness Index reading of 43.09 indicates moderate directional movement
- Key support levels exist at $172.57 (lower Bollinger Band) and $170
Recent whale activity has added to the selling pressure, with one large holder transferring 122,620 SOL ($21.75 million) to Kraken exchange. However, the RSI approaching oversold territory suggests potential price stabilization.
Solana Price Prediction
While immediate pressure remains bearish, multiple technical and fundamental factors suggest potential stabilization:
- Critical support at $175 must hold to maintain bullish structure
- A break above $193 could trigger a 7% rally toward $207
- Failure to hold $170 could see prices test $150
Traders should monitor the $175 support level and daily volume patterns for signs of trend reversal or continuation. The widening Bollinger Bands indicate increased volatility ahead, suggesting careful position sizing and risk management are crucial in the current market environment.
Read also: Solana Price Prediction 2025: How High Can Ethereum Killer SOL Price Go?
- Check out our free forex signals
- Follow the top economic events on FX Leaders economic calendar
- Trade better, discover more Forex Trading Strategies
- Open a FREE Trading Account
- Read our latest reviews on: Avatrade, Exness, HFM and XM
Related Articles


Sidebar rates
Related Posts
