GameStop (GME) Bullish Divergence Signals Potential Upside: Key Levels to Watch

GameStop (GME) Approaches Key Support Levels
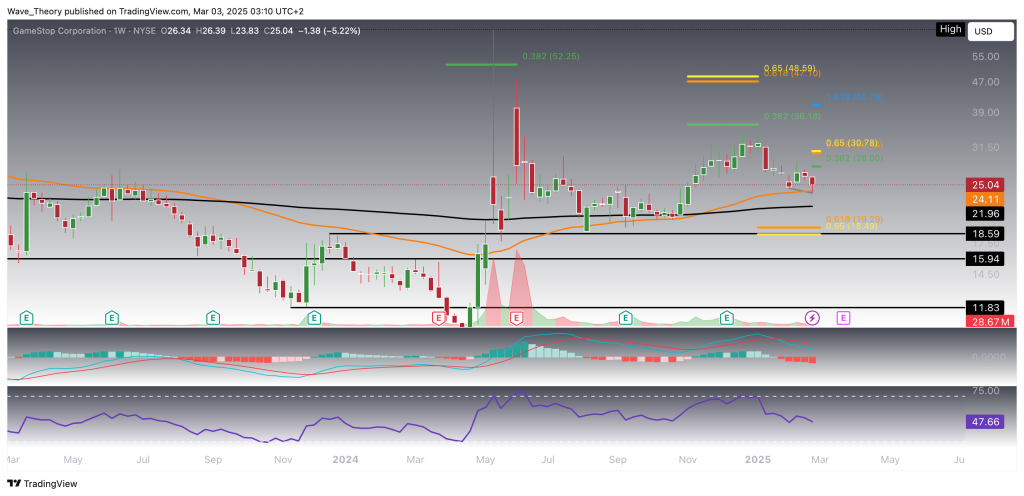
GameStop (GME) has been in a sustained downtrend over the last eight weeks but is now approaching a key technical support level at the 50-week EMA, currently sitting at $24.11. This level will be crucial to monitor, as a failure to hold could see GME retrace to the golden ratio level at $18.5, where strong support lies. However, should GME find support at the 50-week EMA, a bounce could lead to a recovery towards the next Fibonacci resistance levels at $28 and $30.5.
The technical indicators on the weekly chart are mixed. The MACD histogram is trending downward, with the MACD lines bearishly crossed, indicating potential further weakness. At the same time, the RSI remains neutral, suggesting neither overbought nor oversold conditions. Importantly, the EMAs still display a golden crossover, which confirms a bullish mid-term trend despite recent downward price action. This presents a critical inflection point for GME, where traders should closely watch price behavior around the support and resistance levels for further cues.
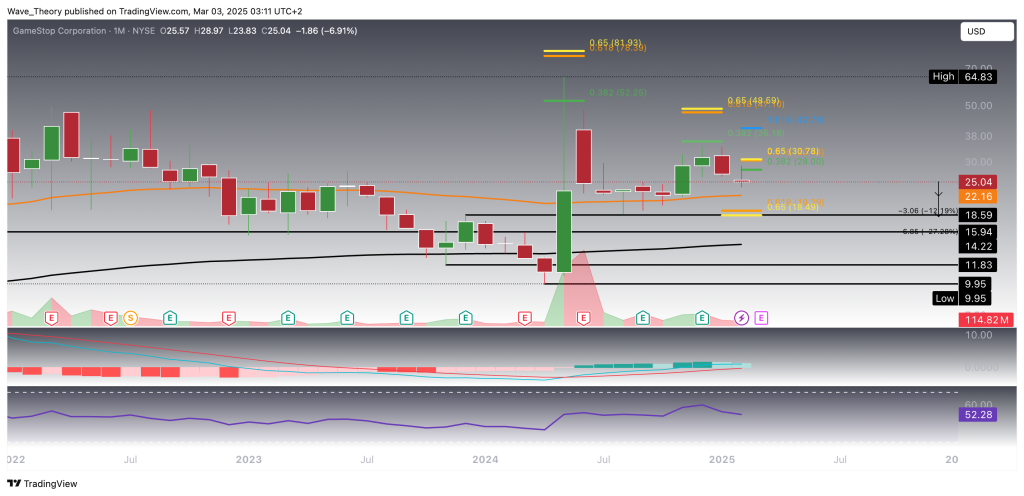
GameStop (GME) may face further downside risk, with the potential for a retracement of 12% to 27%. On the monthly chart, the MACD histogram has continued to decline bearishly since last month, suggesting increasing bearish momentum. However, the MACD lines and EMAs remain bullishly crossed, confirming that the long-term trend is still upward. The RSI is moving within neutral regions, not indicating extreme conditions at this point.
Importantly, GME failed to break the 0.382 Fibonacci resistance at $36.2 last month, signaling that the correction phase remains intact. Given this, GME could potentially pull back to the 50-month EMA at $22.16 or even further to the golden ratio level at $18.5. Additionally, a significant support zone lies between $16 and $18.6, which may serve as a key level for buyers to step in if the price continues to decline. Traders should closely monitor price action around these levels to assess the potential for a reversal or continuation of the current correction.
Daily Chart: Bullish Divergence On The RSI Emerges
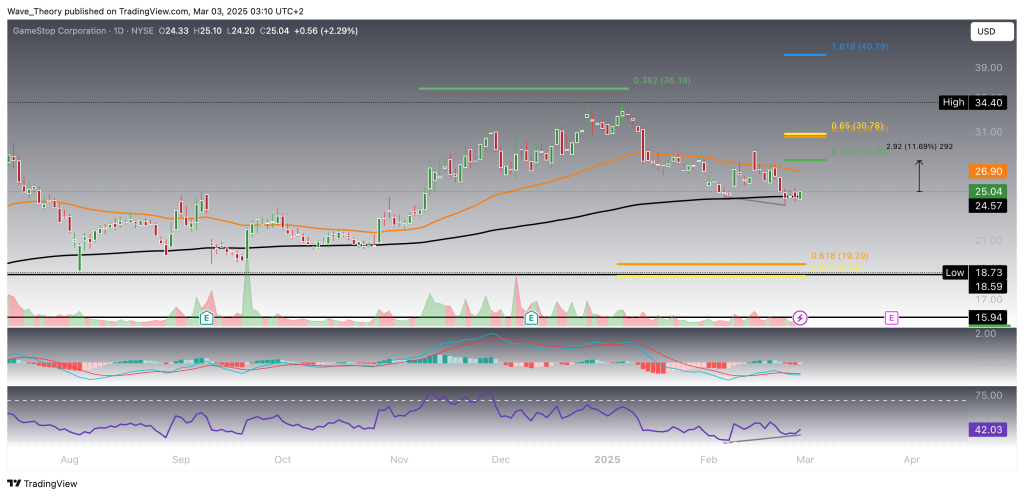
On the daily chart, a bullish divergence is emerging on the RSI, suggesting a potential shift in momentum that could drive GameStop (GME) upward. This bullish divergence may pave the way for a surge of approximately 11.7%, potentially taking the price to the 0.382 Fibonacci resistance at $28. To fully invalidate the current correction phase, GME would need to break through the golden ratio level at $30.5. A successful break above this level could allow the stock to reattempt the 0.382 Fibonacci resistance at $36.2.
Additionally, the MACD histogram is ticking higher today, showing early signs of a potential bullish reversal, though the MACD lines remain bearishly crossed for now. Meanwhile, the EMAs continue to display a golden crossover, reinforcing a bullish trend in the short- to medium-term time frames. Traders should watch for further confirmation of this potential upward movement as GME approaches these critical levels.
Summary
- Check out our free forex signals
- Follow the top economic events on FX Leaders economic calendar
- Trade better, discover more Forex Trading Strategies
- Open a FREE Trading Account
- Read our latest reviews on: Avatrade, Exness, HFM and XM
Related Articles


Sidebar rates
Related Posts
