FTSE Places Largest Rally Leg on Record – Faces Technical Hurdle
Friday marked 15 winning sessions, the longest on record, today’s market looks set to extend a day further.
Quick overview
- The FTSE gained 1.95% as hopes for global trade deals rise following Trump's comments.
- IAG led the index with a 5.01% increase, benefiting from lower crude oil prices.
- The market remains in a bear trend, facing resistance at 8,668 and immediate support at 8,481.
- A bullish trend would require prices to rise above the Ichimoku cloud and the RSI to exceed 70.
Live FTSE Chart

Friday marked 15 winning sessions, the longest on record, today’s market looks set to extend a day further.
- FTSE up nearly 2%
- IAG leads the pack
- Technical hurdles on the day chart
The FTSE gained 1.95% this morning as investors see hopes for global trade deals after Trumps comments.
Trump Opens Possibility of Trade Deals
Talking to reporters on Air Force One, Trump stated that US officials would be meeting with many countries on trade deals, including China.
When reporters asked if any trade agreements would be announced this week, Trump said “that could very well be”.
The US President also suggested he did not expect to reach an agreement with all countries. But rather would be “setting a certain tariff” for those trading partners in the next weeks.
IAG Leads Index Higher
IAG, the holding company of British Airways and Iberia, rose 5.01% this morning leading the UK’s blue-chip index.
Airliners have profited over the past weeks from a drop in crude oil prices over the past week. Today’s news that OPEC added another 411k barrels per day for June sent WTI lower by 3%.
FTSE Day Chart
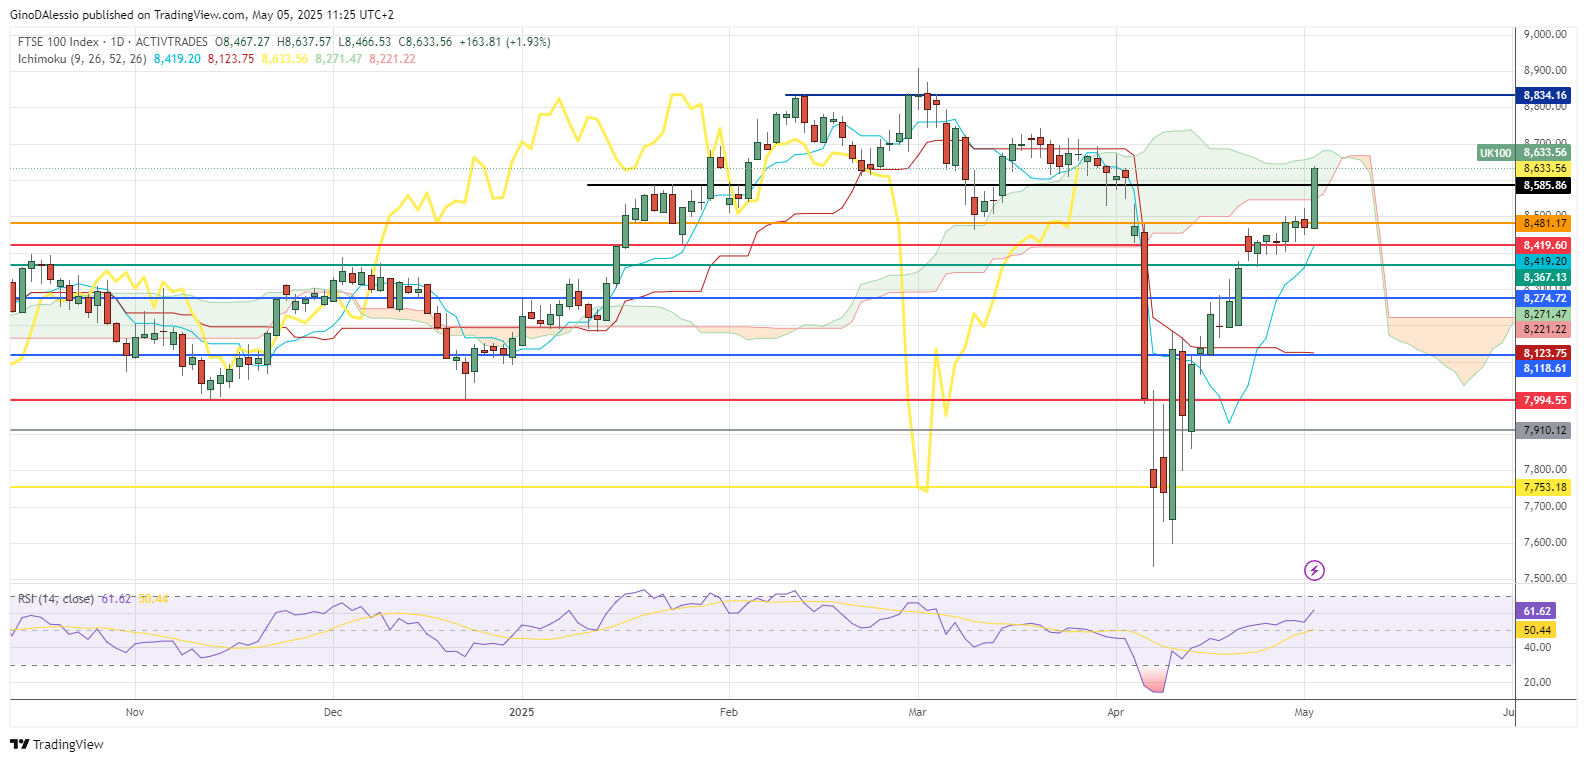
Technical View
The day chart above for the FTSE shows a market still in a bear trend with prices below the Ichimoku cloud.
The market is facing resistance from the cloud at 8,668, while a close at current levels would have broken the resistance at 8,585 (black line).
Immediate support is at 8,481 (orange line), which coincides with a previous all-time high from May 2024.
To consider a bull trend, we would need to see prices above the cloud, including the Lagging line (yellow line).
To confirm the strength of the bull trend I would want to see the RSI above the level of 70. We would get further confirmation of the trend if there is a close above the previous highest candle body at 8,834 (blue line).
- Check out our free forex signals
- Follow the top economic events on FX Leaders economic calendar
- Trade better, discover more Forex Trading Strategies
- Open a FREE Trading Account
- Read our latest reviews on: Avatrade, Exness, HFM and XM
Related Articles
Sidebar rates
