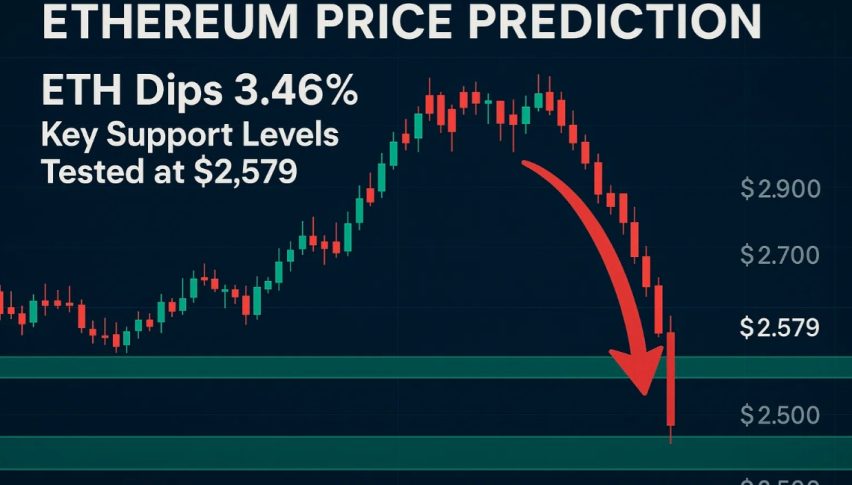
Ethereum Price Prediction: ETH Dips 3.46%—Key Support Levels Tested at $2,579
Ethereum price hovers at $2,579 amid a 3.46% dip. Key levels at $2,565 & $2,642. Watch for breakout signals as traders eye macro data...
Quick overview
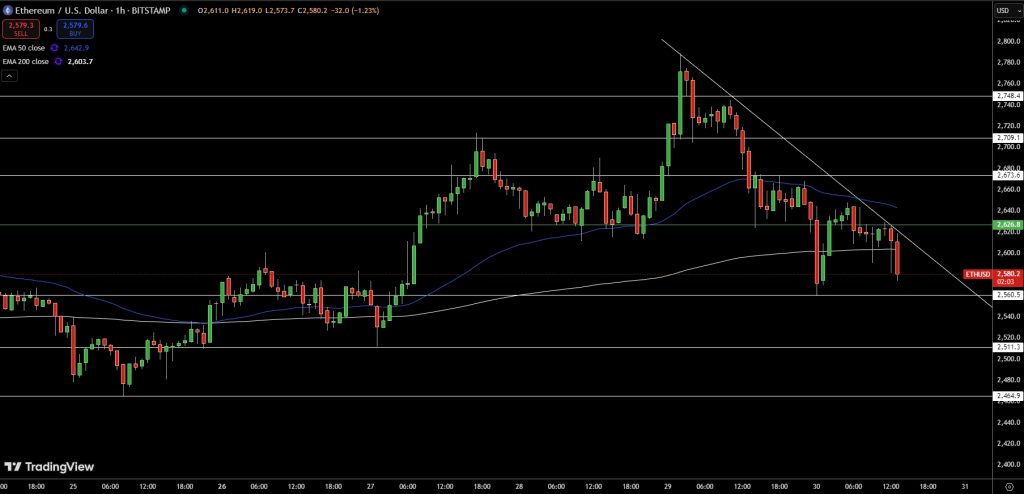
Ethereum (ETH) is struggling to get back on its feet, trading at $2,579, down 3.46% in the last 24 hours. The 1-hour chart is a clear picture: a descending channel with lower highs and lows. Sellers are in control, pushing ETH below critical dynamic resistance lines, the 50-period EMA at $2,642 and the 200-period EMA at $2,603.
Candlestick patterns like spinning tops and shooting stars near the EMAs indicate exhausted buying pressure. The chart is indecisive under the upper trendline, the MACD histogram is fading and the signal lines are trying to converge. The RSI is below 40, near oversold but no strong bullish divergence.
Ethereum Technical Analysis: Key Support and Resistance Levels to Watch
ETH/USD is looking at support zones:
- Immediate support: $2,565
- Further downside targets: $2,511 and $2,464
Above $2,642 with strong bullish candles like engulfing patterns or three white soldiers could be the way to $2,709-$2,748. But momentum is weak, so a decisive move is needed for any conviction
What’s the Play? Scenarios and Strategies
For traders looking for clarity:
- Bullish Scenario: Break above $2,642 with confirmation. This could be the start of a move to $2,709-$2,748 if accompanied by a MACD crossover and increasing volume.
- Bearish Scenario: Break below $2,565 with heavy bearish candles (e.g. three black crows) could be the start of a move to $2,511 or $2,464.
- Neutral Outlook: Wait for a confirmed break or breakdown from the descending channel before committing capital.
Ethereum Outlook: Stay Nimble, Eyes on Data
The broader backdrop adds complexity. Recent U.S. economic data, including a softer-than-expected Core PCE Price Index (0.1% MoM) and mixed consumer sentiment, injects caution into risk assets.
ETH’s 24-hour trading volume of $23 billion and a market cap of $311 billion suggest ample liquidity but also heightened volatility.
With the Chicago PMI slumping to 40.5 and Revised UoM Inflation Expectations dipping to 6.6%, macroeconomic headwinds could weigh on crypto sentiment. Staying nimble and setting clear entry and exit points is crucial as ETH approaches critical levels.
- Check out our free forex signals
- Follow the top economic events on FX Leaders economic calendar
- Trade better, discover more Forex Trading Strategies
- Open a FREE Trading Account
- Read our latest reviews on: Avatrade, Exness, HFM and XM
Related Articles


Sidebar rates
Related Posts
