Gold Price Slips Below $3,355 as Dollar Surges; Israel-Iran Conflict Escalates
Gold drops as dollar surges and rate cut hopes fade. While conflict between Israel and Iran usually boosts demand for safe-haven assets...
Quick overview
- Gold prices have dropped as the dollar strengthens and hopes for rate cuts diminish.
- Escalating tensions between Israel and Iran have led traders to avoid taking bold positions in gold.
- The Federal Reserve has maintained steady rates, with only two cuts anticipated this year, impacting gold demand.
- Technical indicators show gold breaking below key support levels, suggesting continued downside risk.
Gold drops as dollar surges and rate cut hopes fade. While conflict between Israel and Iran usually boosts demand for safe-haven assets, traders are not taking bold positions.
Tensions escalated after Israel bombed Iranian nuclear facilities and Iran hit back with missiles and drones, targeting an Israeli hospital. With no signs of de-escalation and the White House saying former President Trump will decide in two weeks if the US will intervene, uncertainty remains high.
“Right now there’s a fluid situation in the Middle East that causes traders not to take any aggressive position,” said Kelvin Wong, senior analyst at OANDA. As risk appetite disappears, gold’s safe-haven appeal is being overshadowed by other macro factors.
Fed Holds Steady as Rate Cut Bets Shrink
The Federal Reserve held rates steady on Wednesday and signaled only two rate cuts this year. Markets were hoping for more aggressive easing after Trump publicly urged the Fed to cut rates by 2.5%.
Analysts at ANZ said “steady yields and renewed USD strength” have pressured gold. The dollar is set for its biggest weekly gain in over a month, making gold more expensive for international buyers.
Key takeaways:
- Fed keeps rates unchanged
- Trump wants 2.5% rate cut
- USD strength kills gold demand
Technical Breakdown: Gold Breaks Below Key Support
Gold is now at $3,351, below the ascending trendline that supported the uptrend since early June. This is a big technical shift. Price action shows a series of lower highs, with gold stuck below the 50-period EMA at $3,377.
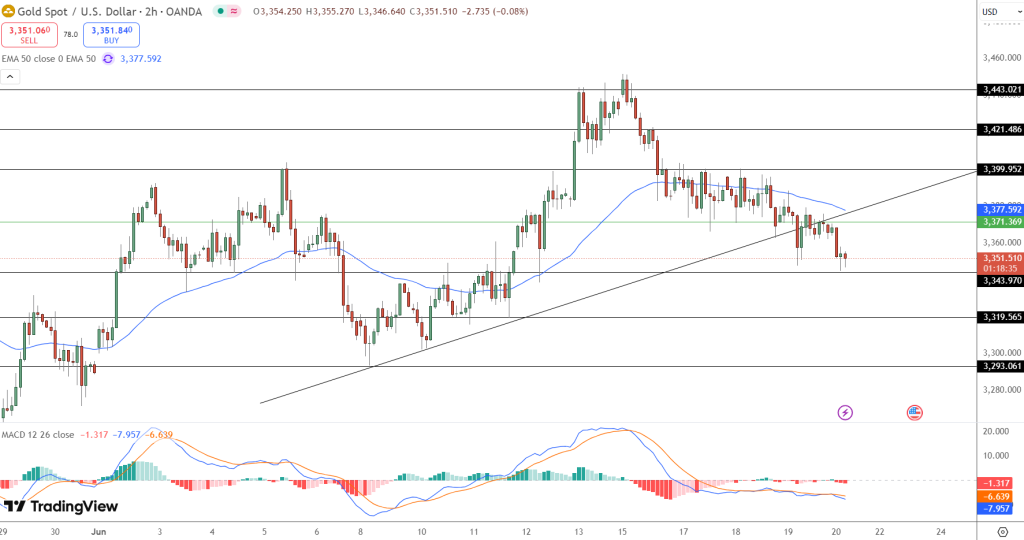
Momentum indicators are red. MACD is bearish, with both lines down and histogram bars negative. No reversal patterns like hammer or bullish engulfing, means downside risk continues.
Support is at $3,343, then $3,319 and $3,293. A break below $3,343 with confirmation, especially a strong red candle, is a short opportunity with stop-loss at $3,371 and target at $3,319.
Conclusion:
Gold is squeezed by both macro and technical. A stronger dollar, dovish Fed and Middle East uncertainty will keep it sideways for now. If $3,343 breaks, bears will push before bulls kick in.
- Check out our free forex signals
- Follow the top economic events on FX Leaders economic calendar
- Trade better, discover more Forex Trading Strategies
- Open a FREE Trading Account