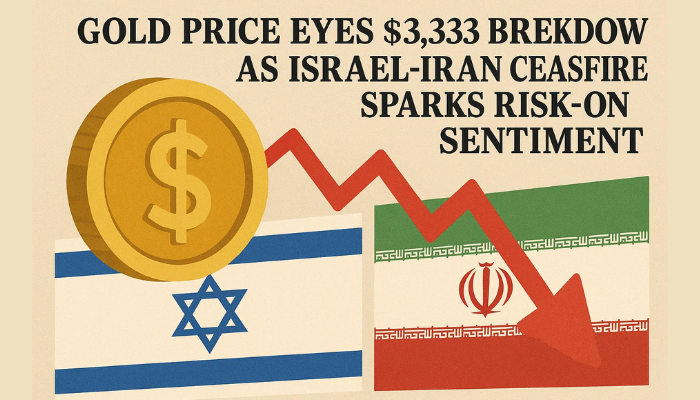
Gold Price Eyes $3,333 Breakdown as Israel-Iran Ceasefire Sparks Risk-On Sentiment
Despite U.S. President Donald Trump announcing a ceasefire between Israel and Iran, gold (XAU/USD) remains under technical pressure...
Quick overview
- Despite a ceasefire announcement by President Trump, gold remains under pressure due to escalating geopolitical tensions.
- Tehran's missile strikes and diplomatic interventions have increased market uncertainty, yet gold is trending downward.
- Technical indicators show a bearish structure for gold, with a critical support level at $3,333 that, if broken, could lead to further declines.
- Traders are advised to consider a short position below $3,330, while remaining cautious of potential short squeezes if buyers defend the trendline.
Despite U.S. President Donald Trump announcing a ceasefire between Israel and Iran, gold (XAU/USD) remains under technical pressure as geopolitical tensions escalate. Tehran fired multiple waves of missiles early Tuesday, killing three in Beersheba, even as it signaled a willingness to pause attacks—if Israel halts aggression. Explosions near Tel Aviv and a flurry of diplomatic activity, including intervention by Qatar and the U.S., have stirred market uncertainty.
While headlines might suggest a safe-haven surge, the chart tells another story: gold is slipping toward a crucial ascending trendline near $3,333. This level, drawn from June’s early swing lows, has historically acted as a launchpad for bullish reversals—but this time, it’s looking fragile.
Price Action Reveals Bearish Intent
Gold’s short-term technical structure shows a clear descending channel forming since mid-June, marked by lower highs and fading bullish momentum. Price has broken beneath the 50-period EMA on the 2-hour chart, which has now started to curve downward—a sign that bears are slowly taking the reins.
Recent candles show indecision: small bodies with upper wicks, often referred to as spinning tops, suggest failed bullish attempts. No bullish engulfing patterns or strong reversals have emerged near support, weakening the case for a bounce.
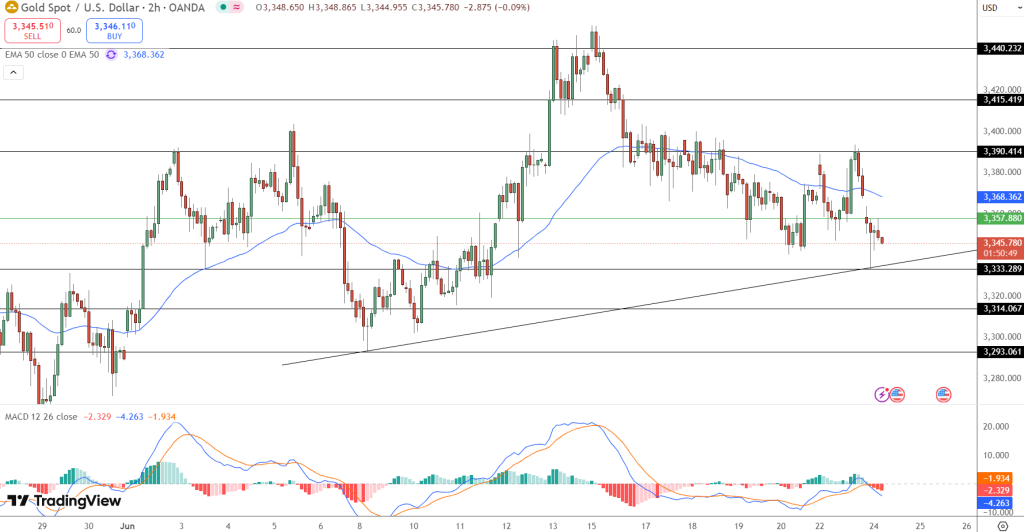
- MACD has flipped bearish: crossover below signal line
- Histogram has turned red, signaling downside momentum
- 50-EMA trending downward, reinforcing bearish control
Gold Trade Setup: Breakdown Below $3,333
If gold decisively breaks below $3,333, it opens the path toward $3,314 and $3,293. A short position below $3,330, with a stop above $3,357 (recent lower high), offers a clean 2:1 risk-reward setup. If buyers defend the trendline, a short squeeze could follow—but current technicals tilt the bias toward a bearish continuation.
With the world watching the Middle East, the market may still reward patience over panic. Technicians, however, are laser-focused on price—not politics.
- Check out our free forex signals
- Follow the top economic events on FX Leaders economic calendar
- Trade better, discover more Forex Trading Strategies
- Open a FREE Trading Account