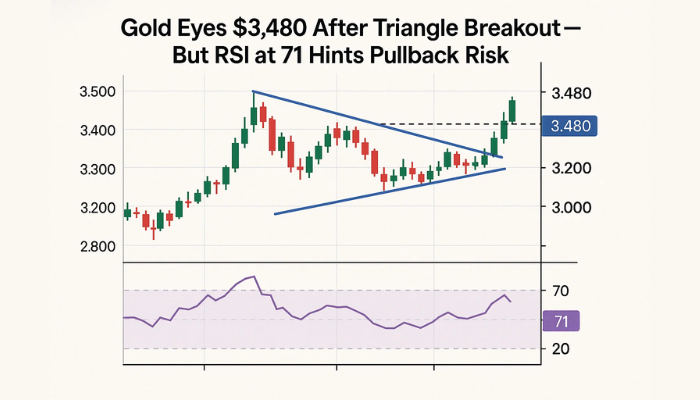
Gold Eyes $3,480 After Triangle Breakout—But RSI at 71 Hints Pullback Risk
Gold rises on Tuesday, breaks out of triangle and heads towards $3,438. The rally came as safe-haven demand picked...
Quick overview
- Gold prices rose on Tuesday, breaking out of a triangle pattern and targeting $3,438 amid increased safe-haven demand due to inflation and geopolitical concerns.
- A US-Japan trade deal alleviated some market anxiety by removing tariffs on key sectors, but the long-term outlook still favors gold as a hedge.
- The breakout above $3,384 indicates a bullish trend, with immediate resistance at $3,438 and potential targets at $3,462.10 and $3,480.54.
- Despite the bullish outlook, the RSI indicates overbought conditions, suggesting a possible short-term consolidation before further gains.
Gold rises on Tuesday, breaks out of triangle and heads towards $3,438. The rally came as safe-haven demand picked up on inflation and geopolitical worries. But a US-Japan trade deal tempered the metal’s upside as global uncertainty eased.
According to Reuters, the deal between Washington and Tokyo will remove tariffs on semiconductor equipment and autos – two key sectors of the global supply chain. While this reduced market anxiety briefly, the long-term backdrop still supports gold as a hedge.
Spot gold (XAU/USD) is at $3,429.91, up 0.04% on the day. Momentum picked up after price broke above the triangle at $3,384. This is bullish and targets are in sight.
Gold Triangle Breakout Confirms Bullish
From a technical perspective, the breakout means a change in short-term trend dynamics. The triangle pattern formed over several weeks finally gave way as price went above $3,384 – also above the 50-period SMA at $3,376.59.
The breakout implies a measured move target at $3,480, a level that aligns with resistance and Fibonacci extensions. This is fresh institutional interest or macro hedging as global monetary policy uncertainty remains.
- Breakout Level: $3,384
- Immediate Resistance: $3,438.71
- Next Targets: $3,462.10 and $3,480.54
- 50-SMA Support: $3,376.59
Gold RSI Cooling Off, Eyes on Support
Despite the breakout, momentum indicators are flashing early warning. The 14-period RSI is at 71.21, a level that historically means overbought. This doesn’t confirm a reversal but often precedes consolidation.
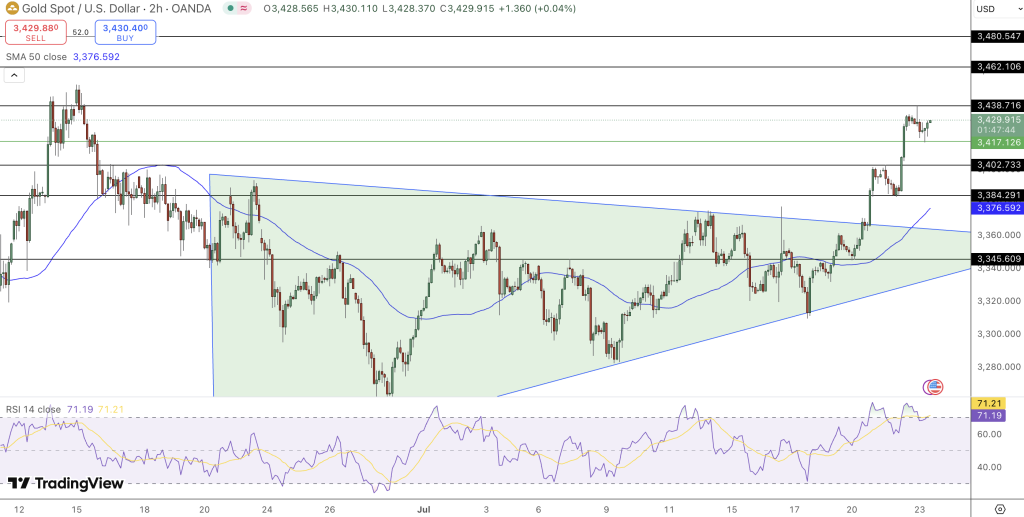
Price is supported above the breakout zone, with nearby levels at $3,417.12 and $3,402.73 as dip-buying opportunities. A deeper pullback to $3,384 could be healthy, giving bulls some room to breathe.
- RSI (14): 71.21 (Overbought)
- Support 1: $3,417.12
- Support 2: $3,402.73
- Breakout Zone: $3,384.29
Conclusion
Gold is still looking good after the breakout but be aware of short-term exhaustion. RSI is high and geopolitical stories are changing, price may dip before heading to $3,480. As long as it holds above $3,376, the bullish is still valid—trend followers and short-term dip buyers have opportunity.
- Check out our free forex signals
- Follow the top economic events on FX Leaders economic calendar
- Trade better, discover more Forex Trading Strategies
- Open a FREE Trading Account
- Read our latest reviews on: Avatrade, Exness, HFM and XM
Related Articles


Sidebar rates
Related Posts
