Reddit (RDDT) Stock Key Levels to Watch as Rally Targets $230 All-Time High

Quick overview
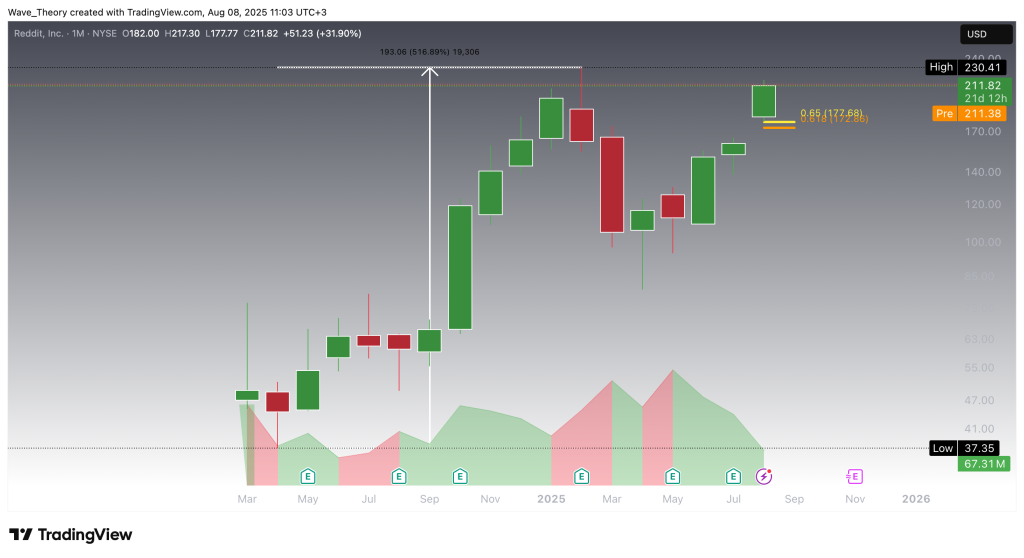
- Reddit (RDDT) has surged approximately 517% since its IPO and is poised to retest its all-time high of $230 after a significant rally from a low of $80.
- The stock has broken above the critical golden ratio resistance at $177, indicating a strong bullish momentum across both weekly and daily timeframes.
- Despite the overall bullish outlook, the 4-hour chart shows early signs of bearish divergence, suggesting a potential near-term correction.
- Key support levels to watch for any pullback are $165 and $127, while a decisive weekly close above $230 is essential for confirming continued bullish momentum.
Since its IPO, Reddit (RDDT) has delivered a remarkable gain of approximately 517%. Following a brief correction earlier this year, the stock is now positioning itself for a retest of its all-time high—and potentially, a breakout to new record levels.
Reddit Stock (RDDT) Breaks Key Resistance, Sets Sights on All-Time High
Between February and April, Reddit (RDDT) shares fell sharply from their all-time high near $230 to a temporary low around $80. From that trough, the stock staged an exceptional 172.5% rally, decisively clearing the critical golden ratio resistance at $177. This breakout effectively invalidates the prior correction phase and positions RDDT for a retest of the $230 all-time high.
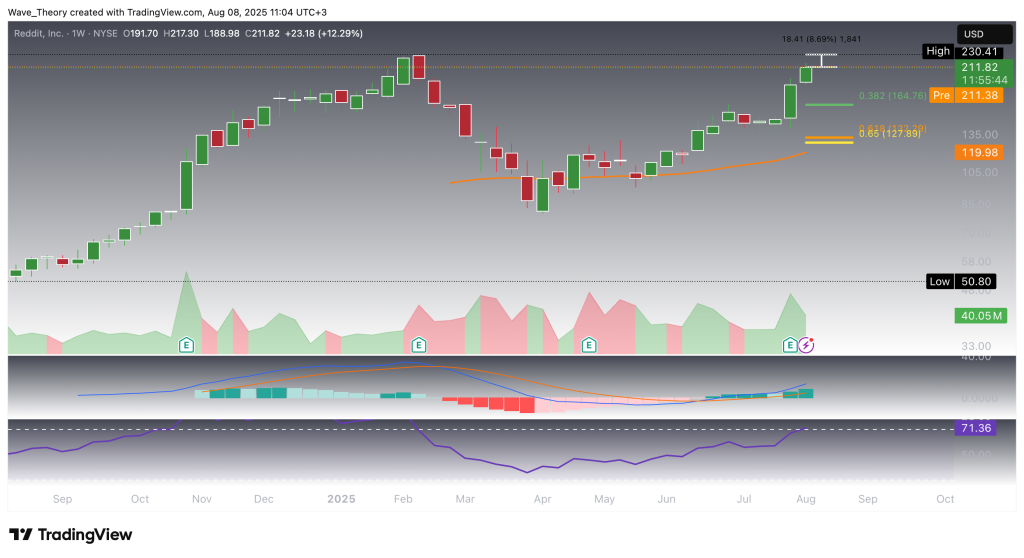
Rather Bullish Outlook on the Weekly Chart
This setup points to an additional upside potential of approximately 5.7%. On the weekly timeframe, the MACD lines have crossed bullishly, and the histogram has been advancing for the second consecutive week—signaling strengthening momentum. Meanwhile, the RSI has entered overbought territory but is not yet providing any immediate bullish or bearish reversal signals.
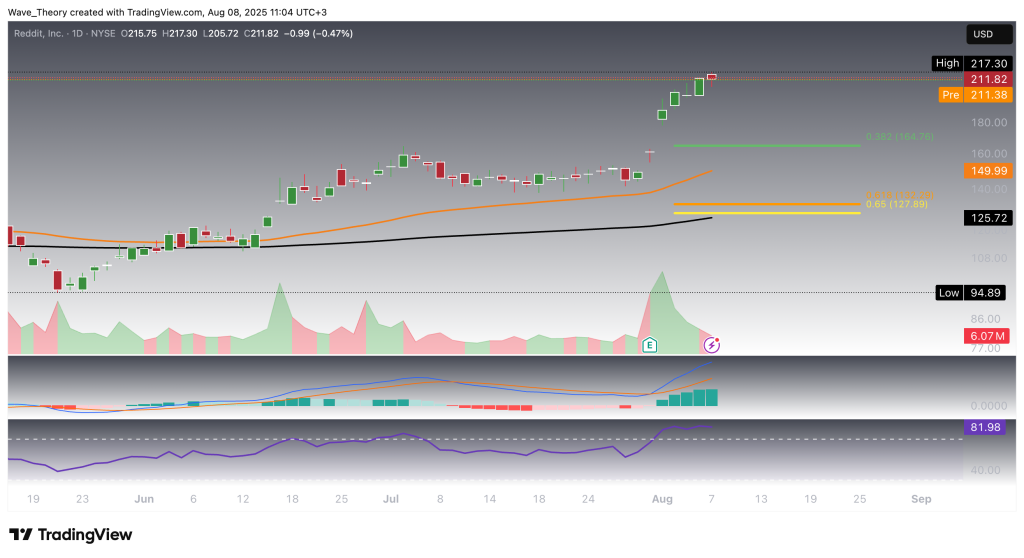
More Bullish Signals on the Daily Chart
On the daily timeframe, technical indicators continue to favor the bulls. Both the MACD lines and EMAs are bullishly crossed, reinforcing the short- to medium-term uptrend, while the MACD histogram shows a strong upward trajectory. The RSI is holding in overbought territory but has yet to issue any bearish divergences or reversal signals.
That said, today’s session opened on a bearish note, making it critical to monitor whether this develops into a deeper pullback or merely a minor intraday dip.
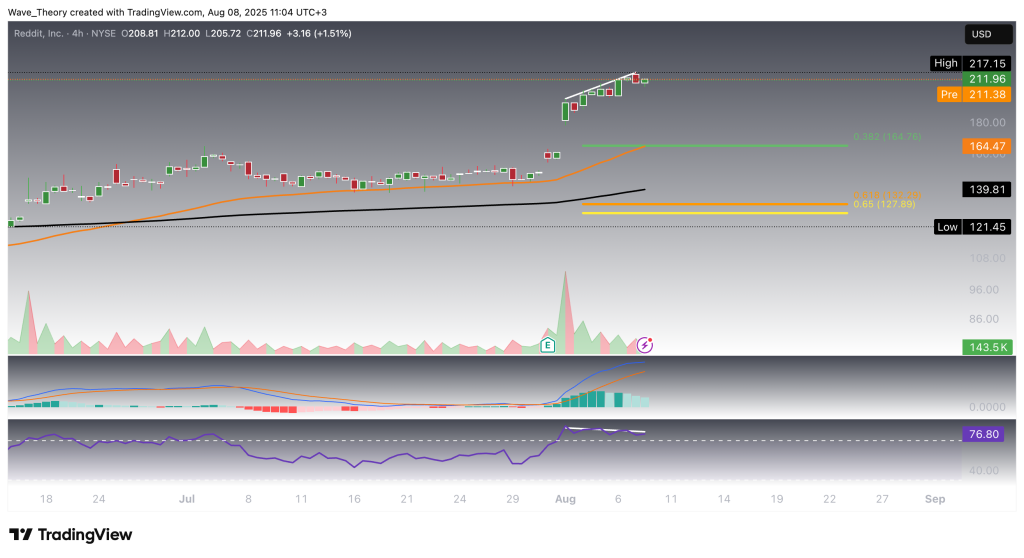
Bearish Divergence Emerges on the 4H Chart
The 4-hour chart is flashing early bearish signals for Reddit. The MACD histogram has been declining steadily, while the RSI has formed a clear bearish divergence, indicating weakening momentum. Should a correction unfold, key Fibonacci support levels to watch are $165 and $127, where the 50- and 200-period 4H EMAs provide additional structural support.
Despite these cautionary signs, the MACD lines remain bullishly crossed and the EMAs continue to exhibit a golden crossover—confirming that the short-term trend remains fundamentally bullish.
Summary & Key Levels — Reddit (RDDT) Technical Outlook
Reddit (RDDT) has demonstrated a strong recovery after dropping from its all-time high near $230 to a low around $80 earlier this year, rallying over 170% and invalidating the prior correction by breaking above the golden ratio resistance at $177. This breakout sets the stage for a retest of the $230 all-time high.
Key resistance:
-
$230 — all-time high to watch for a decisive breakout
-
$177 — critical golden ratio level, now acting as support
Support levels to monitor in case of a pullback:
-
$165 — 50-period 4H EMA and near-term Fibonacci support
-
$127 — golden ratio support level
Momentum remains largely bullish across weekly and daily timeframes, with MACD lines bullishly crossed and EMA golden crossovers confirming trend strength. However, shorter-term charts (4H) show emerging bearish divergences and weakening momentum, signaling potential for a near-term corrective phase.
In sum, while the medium- to long-term outlook favors further upside, traders should watch $165 and $127 for potential entry points, and a weekly close above $230 will be critical to confirm sustained bullish continuation.
- Check out our free forex signals
- Follow the top economic events on FX Leaders economic calendar
- Trade better, discover more Forex Trading Strategies
- Open a FREE Trading Account