Gold Ticks to $3,350: 90% Fed Rate Cut Odds Fuel Bullion Buzz
Gold edges up on Tuesday as US inflation data boosts rate cut hopes Spot prices settle near $3,351.50 an ounce after softer inflation...
Quick overview
- Gold prices increased to around $3,351.50 an ounce following softer US inflation data.
- The US Consumer Price Index rose 0.2% in July, maintaining a year-over-year increase of 2.7%, which has led traders to anticipate a near-90% chance of a rate cut at the next Fed meeting.
- The dollar weakened post-CPI release, making gold more accessible for foreign buyers, while geopolitical developments are being closely monitored.
- Gold is currently consolidating in a symmetrical triangle pattern, with key resistance at $3,369 and support levels at $3,338 and $3,315.
Gold edges up on Tuesday as US inflation data boosts rate cut hopes Spot prices settle near $3,351.50 an ounce after softer inflation numbers
US Consumer Price Index rose 0.2% in July, as expected, and 2.7% year-over-year, unchanged from June. Core CPI climbed 0.3% month-over-month, the biggest gain since January, to 3.1% year-over-year from 2.9% in June.
This gentle inflation profile, combined with weaker labor market data earlier this month, has traders pricing in a near-90% chance of a rate cut at the next Fed meeting. Lower rates tend to weaken the dollar and reduce bond yields, which is bullish for gold.
Dollar weakness and geopolitical calm
The dollar softened after the CPI release, making gold more affordable for foreign buyers. The 90-day extension of the US-China tariff truce also helped calm risk sentiment, although investors are still watching global politics.
🌐 Gold edges up on expectations of an early Fed rate cut, weaker USD supports rally.
On Tuesday, August 12, gold rose slightly to 3,348 USD/oz after the U.S. reported a moderate July CPI, reinforcing expectations that the Fed will cut rates in September (94% probability). pic.twitter.com/bLGWXIWuC2
— Activtrades (@Activtradespro) August 13, 2025
Market participants are considering the impact of upcoming diplomatic events, including the meeting between US President Donald Trump and Russian President Vladimir Putin. While not expected to produce immediate policy changes, these events can influence safe-haven flows into gold if geopolitical tensions flare up.
Other precious metals were mixed—silver gained a bit, while platinum and palladium traded in a narrow range, as industrial metals were cautious.
Gold Technical picture and trade scenarios
Gold is consolidating in a symmetrical triangle, above the ascending trendline from the late-July lows. The 50-day simple moving average at $3,369 is resistance, while support is at $3,338 and $3,315.
The Relative Strength Index is neutral at 49.75, with room for a breakout, and the MACD is turning bullish with a potential signal-line crossover. Triangles like this often precede a big move once the price breaks the trendline.
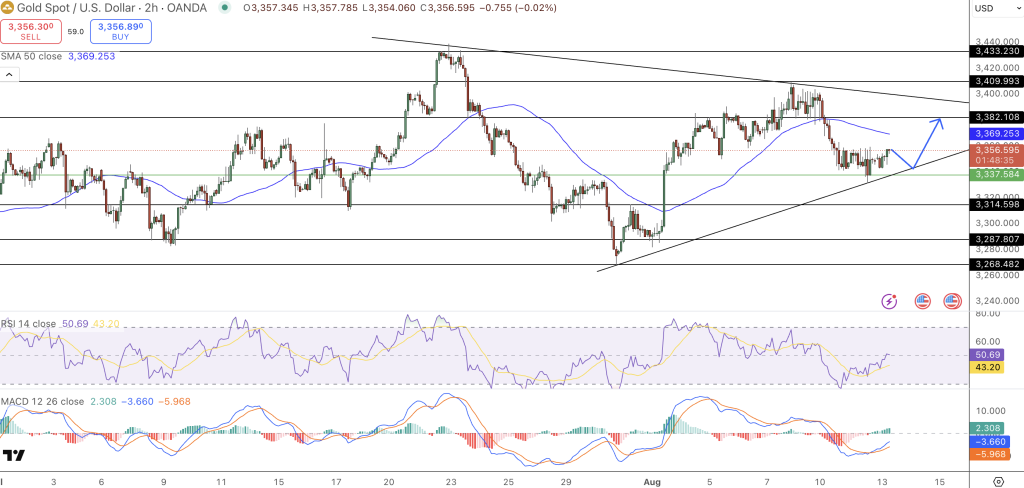
Key levels to watch:
- Resistance: $3,382, then $3,410 and $3,433.
- Support: $3,338, then $3,315 and $3,288.Above $3,382 and gold could retest $3,400, below $3,338 and it could accelerate to $3,315. For short-term traders, confirmation is key—act after the break rather than before to avoid false signals.
With rate cut expectations firm and the dollar weak, the macro is bullish. But gold’s next big move will be driven by US data and the Fed in September. Until then, traders can trade the range, looking for volume and momentum to confirm the next move.
- Check out our free forex signals
- Follow the top economic events on FX Leaders economic calendar
- Trade better, discover more Forex Trading Strategies
- Open a FREE Trading Account