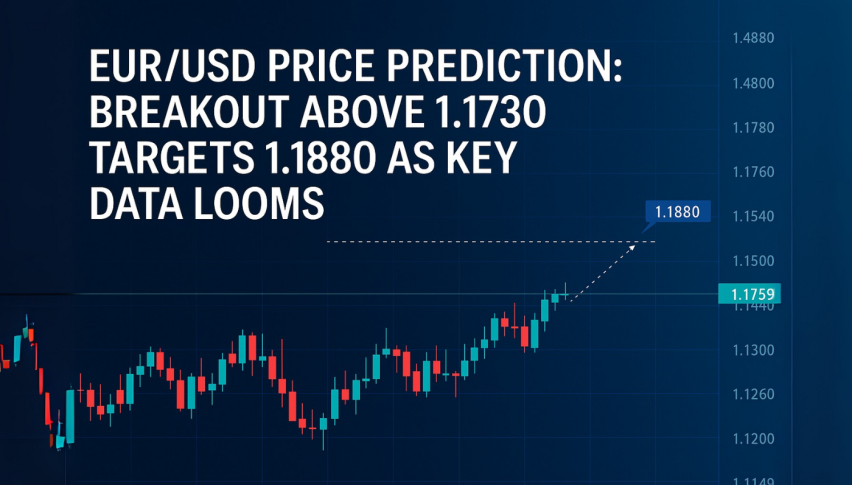
EUR/USD Price Prediction: Breakout Above 1.1730 Targets 1.1880 as Key Data Looms
EUR/USD has finally broken out of its weeks long consolidation, above the upper boundary of the symmetrical triangle...
Quick overview
- EUR/USD has broken out of a weeks-long consolidation, surpassing the 1.1730 level and indicating strong buyer conviction.
- The bullish momentum is supported by technical indicators, with RSI at 70 and MACD turning positive.
- Upcoming economic data from the eurozone and the US will be crucial in determining the sustainability of this breakout.
- Resistance levels are identified at 1.1780-1.1835, while support has shifted to 1.1670-1.1640.
EUR/USD has finally broken out of its weeks long consolidation, above the upper boundary of the symmetrical triangle that had capped price action all of August. The move took out the 1.1730 level that had held rallies earlier in the month. The strong bullish candle shows conviction from buyers after weeks of indecision between 1.1580 and 1.1730.
On the 2 hour chart EUR/USD had been making higher lows while sellers defended the 1.1670 area. The break above 1.1730 confirms buyers are in control and sentiment is now firmly euro positive.
Upcoming Data to Watch
This week is packed with eurozone and US data that will drive the pair:
- Eurozone: German Ifo Business Climate rose slightly to 88.7, German and Spanish CPI later in the week will give a better view of inflation.
- United States: Key US prints include Durable Goods Orders, CB Consumer Confidence, Q2 GDP and Core PCE. These will along with Fed comments determine if the dollar can get back on track.
The balance between eurozone sentiment and US economic strength will be the key to whether this breakout holds or not.
Technical Outlook for EUR/USD
Momentum indicators are bullish. RSI has reached 70, the breakout move is strong, MACD has turned positive with widening signal lines. Classic signs of upward momentum.
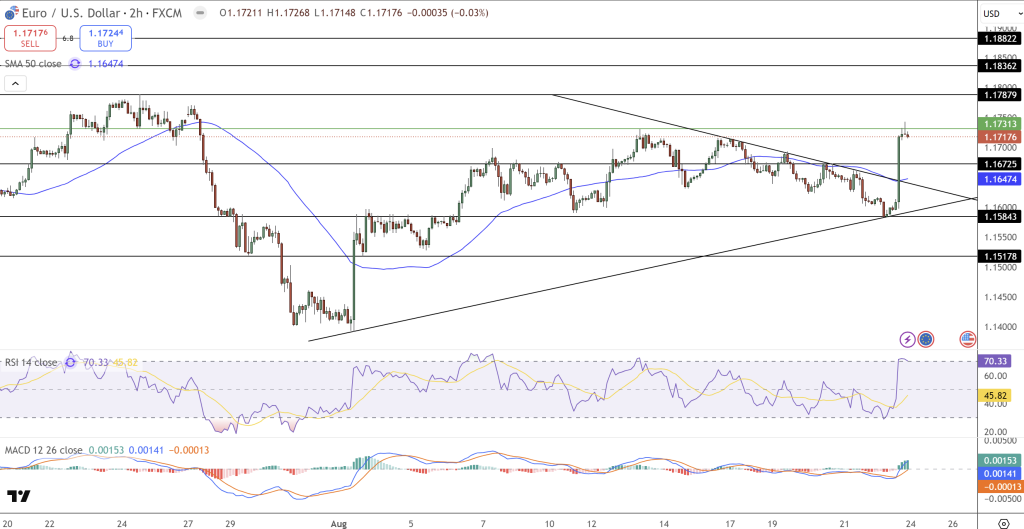
Resistance is at 1.1780-1.1835 the area that capped price in late July. A close above this zone would open the way to 1.1880 and 1.1900. On the downside 1.1670-1.1640 was resistance and now becomes support, a clear stop loss for longs.
For traders the setup is simple: entries above 1.1730 are trend continuation, stops under 1.1640 to manage risk. Upside targets 1.1780, 1.1835 and 1.1880 if momentum holds.
- Check out our free forex signals
- Follow the top economic events on FX Leaders economic calendar
- Trade better, discover more Forex Trading Strategies
- Open a FREE Trading Account