Silver Price Prediction: $49 Test Ahead as Fed Cuts and Shutdown Fuel Rally
Silver is holding steady near $47.37 after a big September rally that took the metal to new multi-month highs.
Quick overview
- Silver is currently stable around $47.37 following a significant rally in September driven by rate cuts, political gridlock, and a weaker dollar.
- The recent ADP report indicates a decline in US private payrolls, which may prompt the Federal Reserve to ease monetary policy further.
- Technical analysis shows silver is in a bullish rising channel, with key resistance at $47.84 and potential upside targets at $49.
- Traders are advised to look for buying opportunities in the $46.98-$46.32 range, with a focus on bullish candlestick patterns for confirmation.
Silver is holding steady near $47.37 after a big September rally that took the metal to new multi-month highs. The rally has been driven by the same forces that are driving gold: rate cuts, political gridlock in Washington and a softer dollar.
The ADP report showed US private payrolls fell 32,000 in September, which could accelerate Fed easing. Futures are now pricing in a near-certain 25 basis point cut this month according to CME FedWatch. The government shutdown is also delaying key economic releases like non-farm payrolls, which adds to the uncertainty that makes silver a safe-haven asset.
Analysts also point to broad speculative demand. Commitment of Traders (COT) data shows net longs in silver are rising, but not yet at extreme levels, so there is room for more upside if macro risks intensify.
Silver (XAG/USD) Technical Signals Remain Bullish
From a chart perspective, silver has been up in a well-defined rising channel since mid-September. The structure is higher lows and higher highs, which is bullish. Price hit resistance at $47.84 and paused, forming several small bodied candles that are not reversal but indecision.
[[XAG/USD-graph]]
The 50 day simple moving average at $45.45 is still up, the 100 day average at $42.31 is deeper support. The RSI is at 64, so there is room for more upside before it gets overbought.
Watch for candlestick confirmations. A bullish engulfing candle off channel support would be bullish, a Doji or shooting star near resistance would be bearish.
Silver (XAG/USD) Key Levels and Trade Setup
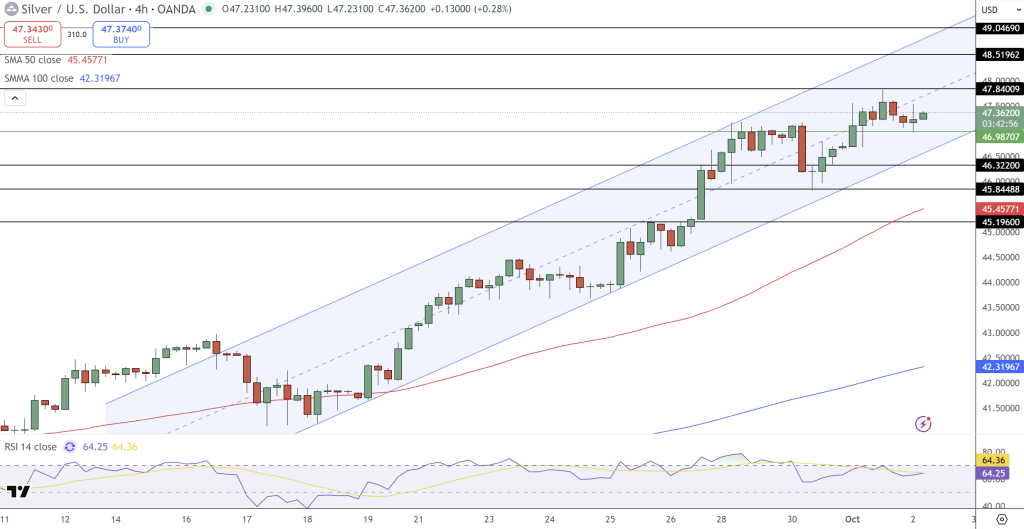
Levels to watch are near term support at $46.98 and $46.32, with stronger support at $45.84. Resistance is at $47.84, then $48.52 and the psychological $49. A close above $47.84 would confirm the breakout and could lead to $49.
For traders a pullback buy looks most balanced. Let silver dip into the $46.98-$46.32 zone and then wait for a bullish candle. Upside targets are $47.84 and $49.05, stop below $45.84. This is in line with the trend and manages risk.
With Fed policy, political chaos and a softer dollar all in silver’s favour, it could go to $49 and maybe even test the August highs if momentum holds.
- Check out our free forex signals
- Follow the top economic events on FX Leaders economic calendar
- Trade better, discover more Forex Trading Strategies
- Open a FREE Trading Account