Gold Standstill – Bearish Butterfly Pattern Plays
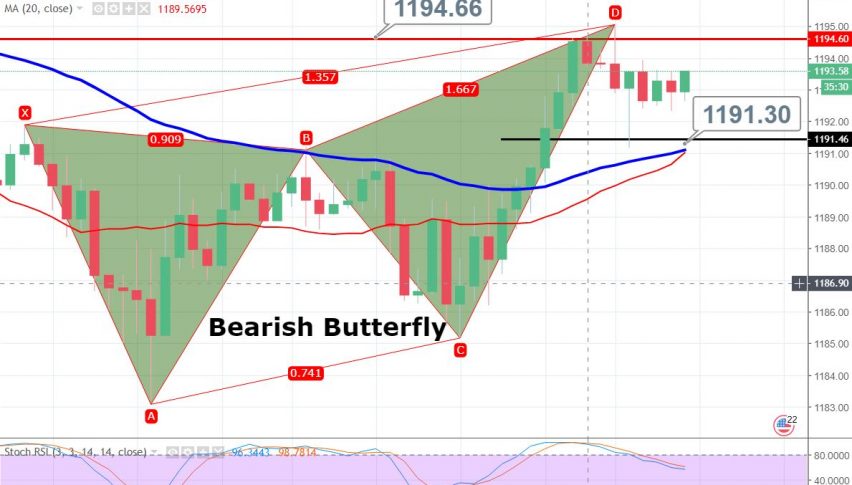
Gold has formed a bearish butterfly pattern with a C to D wave completing at $1,195. Now, the same level is likely to work as a strong...
GOLD prices inched down as robust US numbers potentially boosted the chances of multiple US interest rate hikes over the next year. However, the precious metal is still supported above $1,191 due to a steep fall in the US indices. For your info, there’s a strong negative correlation between the gold and stock markets.
Despite the steep fall in stock markets, the yellow metal hasn’t soared with the same intensity. It’s mainly because of the US producer prices, which rose in September after declining the previous month, adding to a hawkish outlook on the FED’s interest rates.
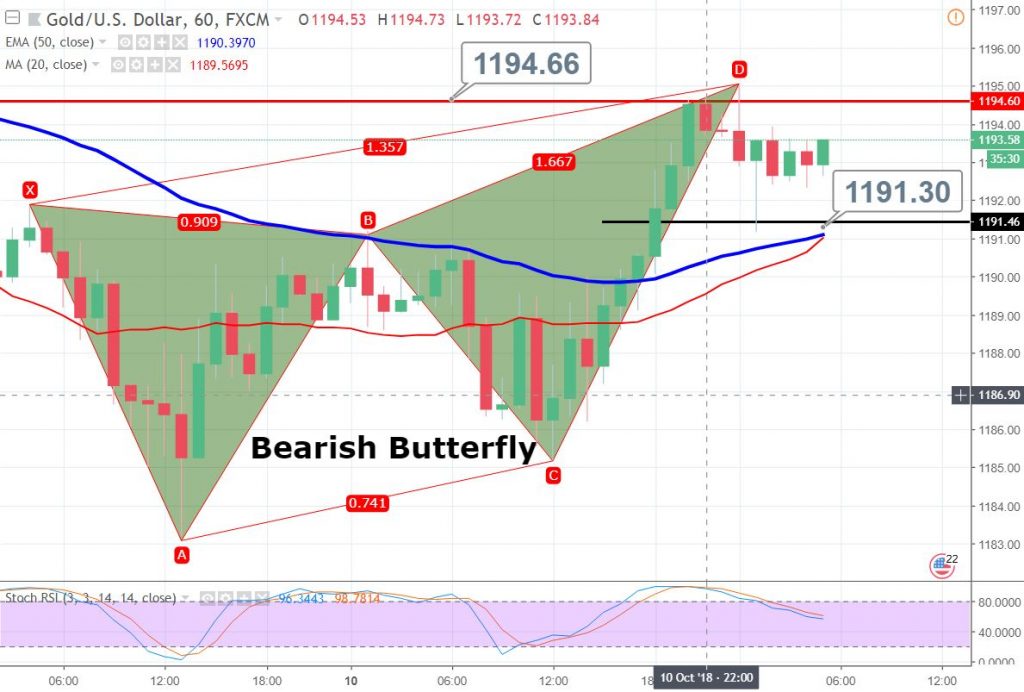
Technically, GOLD has formed a bearish butterfly pattern with a C to D wave completing at $1,195. Now, the same level is likely to work as a strong resistance. On the lower side, $1,191 is a crucial trading level. The bearish breakout can lead gold prices towards $1,187 and $1,184.
The leading indicator RSI is still holding in a buying zone and the lagging indicators 20 & 50 periods EMA are also suggesting the bullish bias of traders.
Gold – XAU/USD-Trade Plan
So, the idea is to stay bullish above $1,191 with an immediate target of $1,195 and $1,197 afterward.
- Check out our free forex signals
- Follow the top economic events on FX Leaders economic calendar
- Trade better, discover more Forex Trading Strategies
- Open a FREE Trading Account
- Read our latest reviews on: Avatrade, Exness, HFM and XM
Related Articles


Sidebar rates
Related Posts
