How to Dictate How Strong A Trend Is
Trends pick up pace or slow down sometimes, but we can easily predict that with technical indicators.
As I have mentioned here quite a few times recently, you can easily spot the pace of a trend on a given financial instrument simply by looking at moving averages. When the larger period moving averages are in play, that means that the trend is not strong enough. In that occasion, the smaller period moving averages get ignored by traders and consequently by the price.
When the smaller period moving averages come into play and take things in their hands, it means that the trend is pretty strong. How come? Well, traders are not waiting for larger period moving averages to catch up with the price since they are slower to move and catch up when the price continues falling fast, as is the case with Crude Oil right now.
Moving averages are even better than trend lines or horizontal lines for indicating trends because they are more flexible then the perfect lines and as you know, much like the universe, markets don’t work in perfect order. The price might move above a descending trend line and trade there for a while which gives you that the downtrend might be over.
But moving averages are more flexible and react to price fluctuations. Also, you can use 3-4 moving averages which let you know when the trend is slowing as they break one by one and when they all get broken, the trend has very likely changed. But, when one goes and another one holds such as in the case below on the H1 Crude Oil chart from yesterday, then you can assume that the trend is still down but it has slowed for the time being.
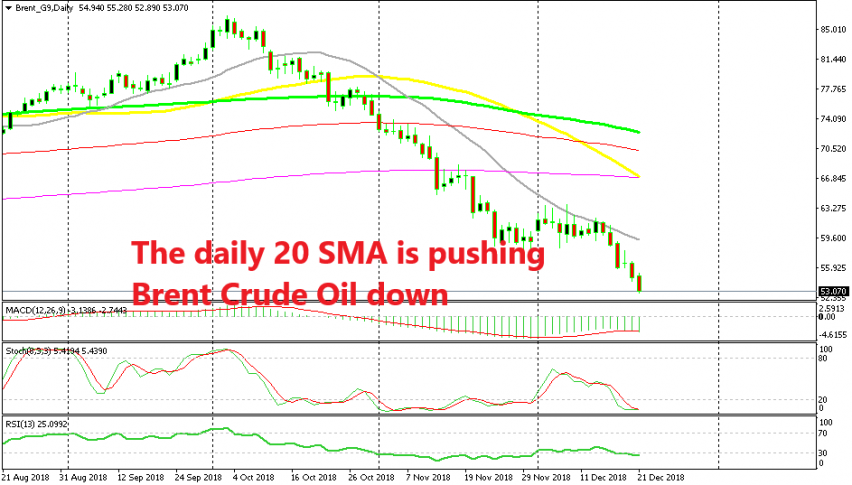
As you can see from the daily chart above, UK Brent crude has made a bearish reversal at the beginning of October and has lost around $33 so far. We see there that the 20 SMA (grey) was the first to reverse down, with the 50 SMA (yellow) only starting to reverse late in November. The larger moving averages haven’t started to reverse yet. The 20 SMA provided resistance earlier this month, so the price is already respecting it.

The 20 SMA and the 50 SMA are pushing the price lower on the H1 chart
If we switch to the H1 chart, we see the same moving average provide resistance this week. The bearish trend resumed again for Crude Oil this week after trading on a range for about three weeks and the decline has been pretty ferocious.
So, the 20 SMA has taken the job of providing resistance and pushing the price lower for Brent crude. It was broken on Wednesday but the 50 SMA too its place and reversed the price lower again. Then, yesterday and today the 20 SMA has taken the job once again and we see Oil slipping lower again.
So, as long as smaller moving averages are in play, the bearish trend in Oil remains strong. These moving averages are also good places to open a sell trade if you want to trade Brent Crude Oil.
- Check out our free forex signals
- Follow the top economic events on FX Leaders economic calendar
- Trade better, discover more Forex Trading Strategies
- Open a FREE Trading Account
Related Articles

Sidebar rates
Related Posts
